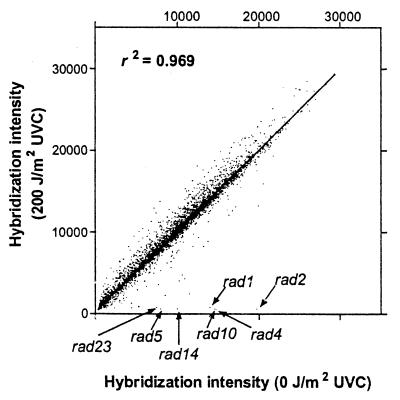
Figure 1.
Scatterplot showing hybridization intensities of the 4,627 deletion strains in the untreated pool (0 J/m2 UVC) versus the treated pool (200 J/m2 UVC). Data for most strains fall close to the line of equivalence, whereas UV-sensitive strains fall near the x axis. Seven known UV sensitive strains are shown with arrows.

