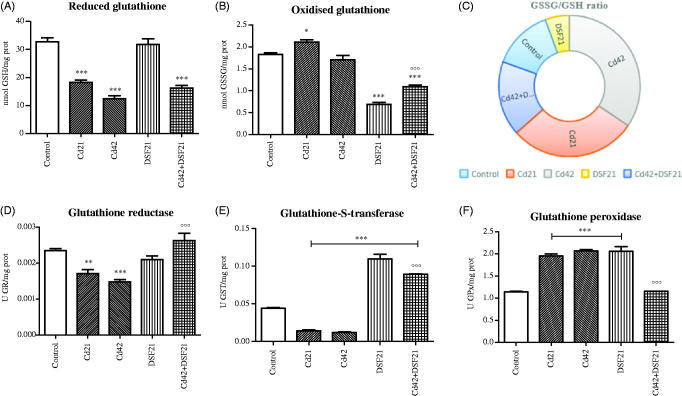
Figure 2.
Representative graphs of glutathione cycle in liver of Wistar rats intact and administered Cd, DSF and a combination of both substances. *See the experimental conditions presented in the section Experimental design. Values are presented as means ± S.D. Labels of statistical significance: compared with the control group (*) and compared with Cd42 subgroup (°). Statistical significance was considered at: ∗p < 0.01, ∗∗p < 0.001, ∗∗∗p < 0.0001 and °°°p < 0.0001. (A, B) Reduced and oxidized glutathione content: presented parameters of antioxidative defence (obtained values, expressed in μM, were recalculated in regard to protein status and expressed as nmol GSH or GSSG/mg proteins for the appropriate discussion of the obtained results). (C) Ratio of oxidized and reduced glutathione: presented parameter of glutathione homeostasis (values are presented as means of GSSG/GSH ratio through chosen time points). (D) GR activity: presented parameter of antioxidative defence (expressed as U GR/mg proteins). (E) GST activity: presented parameter of antioxidative defence (expressed as U GST/mg proteins). (F) GPx activity: presented parameter of antioxidative defence (expressed as U GPx/mg proteins).

