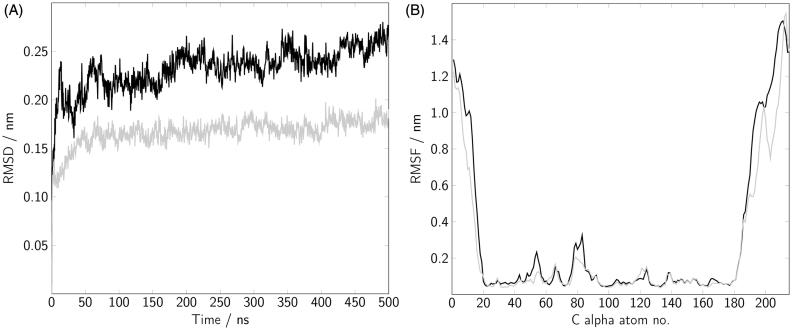
Figure 3.
(A) The root mean square deviation (RMSD) of the Rab5 G domain Cα atoms is shown for a 500 ns MD trajectory including 50 ns of equilibration. (B) The root mean square fluctuations (RMSF) were calculated after superposing the G domain coordinates in each frame to the first frame structure. Data for Rab(GDP) (black) and Rab(GTP) (gray) is averaged over three independent runs.

