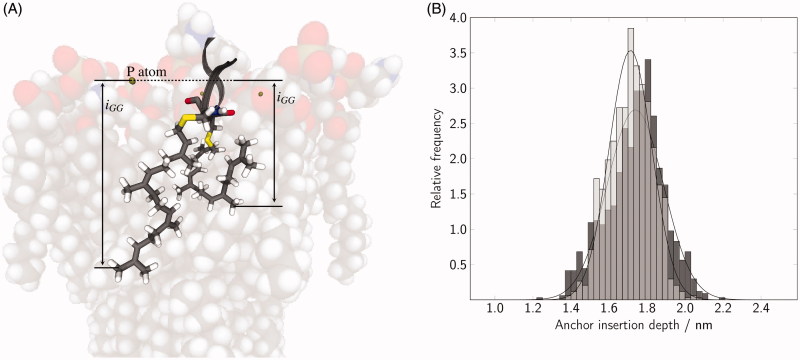
Figure 5.
(A) The insertion depth of the GG chains within the bilayer was calculated as the z-distance between the neighbouring lipid P atoms and the most deeply inserted carbon atom of the GG chains. (B) The distribution of the anchor insertion depth in three averaged runs is shown for Rab(GDP) (black) and Rab(GTP) (gray).

