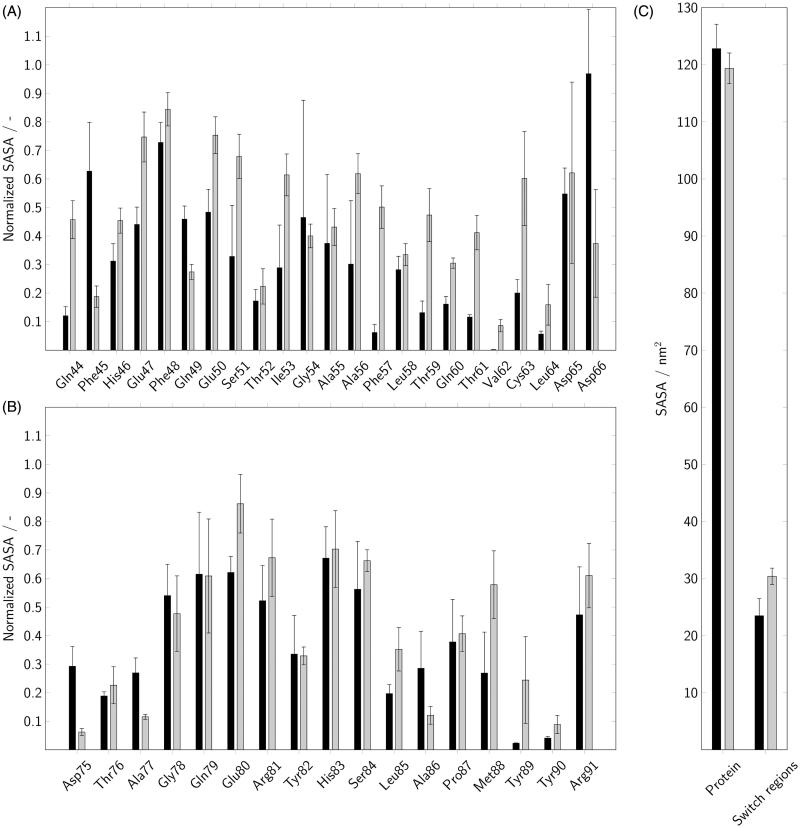
Figure 8.
The normalised solvent-accessible surface area (SASA) of Rab5 was calculated for individual amino acids in the switch I (A) and switch II (B) regions. In addition, the overall SASA was determined for the whole protein as well as for both switch regions (C). Data for Rab(GDP) and Rab(GTP) are coloured in black and gray, respectively.

