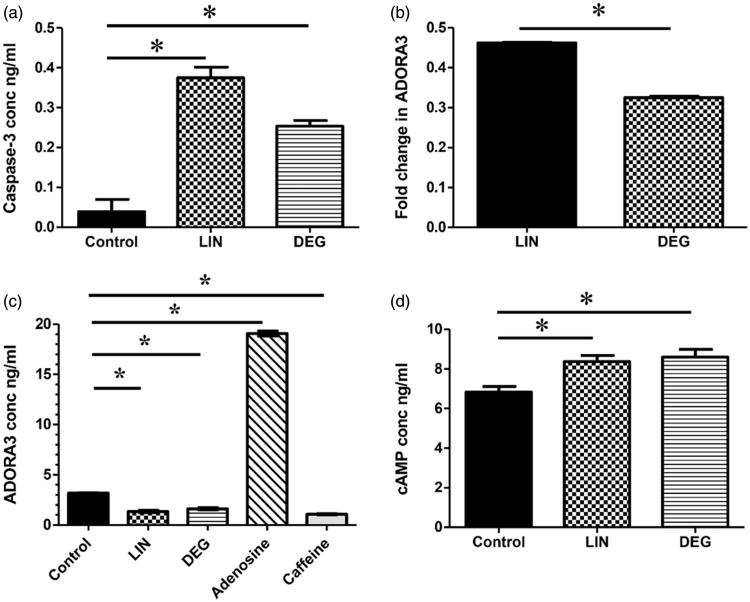
Figure 6.
Effect of linagliptin and its major oxidative degradation product on caspase-3, ADORA3, and intracellular cAMP levels. (a) Active caspase-3 protein levels in control, linagliptin (LIN)-treated, and the degradation product (DEG)-treated HepG2 cells. (b) ADORA3 relative mRNA expression levels in LIN- and DEG-treated HepG2 cells. (c) ADORA3 protein expression levels in LIN-, DEG-, adenosine-, & caffeine-treated HepG2 cells. (d) Intracellular cAMP protein levels in control, LIN-, and DEG-treated HepG2 cells. Gene expression levels were estimated using real-time qPCR. Relative mRNA expression level (fold change) was determined using the 2−ΔΔCt analysis method. Protein levels were estimated using ELISA. Values are presented as means ± SD Statistical analysis was performed using one-way analysis of variance (One-way ANOVA) followed by Bonferroni post hoc test while Student’s t-test was used for relative mRNA data analysis. *Significantly different (at p < .05) versus control untreated cells (a, c, and d) or LIN-treated group (b).

