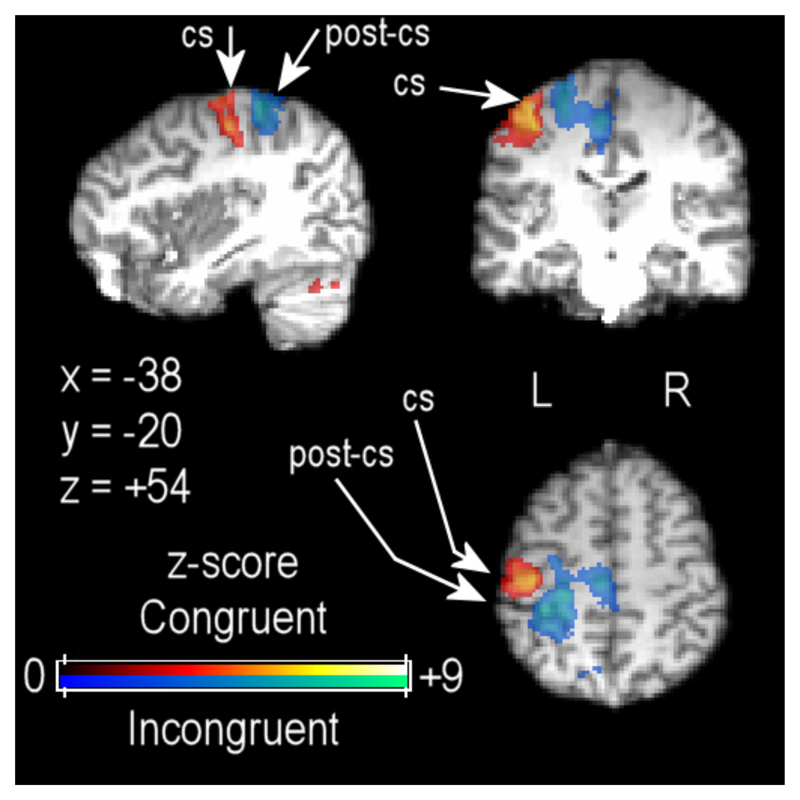
Figure 5.
Functional imaging data showing differential sensorimotor cortex activation for congruent (red to yellow shading) and incongruent (blue to pink shading) hand movements, thresholded at Z > 2.6 with cluster thresholding at p < .05. Functional data are projected onto a single participant’s high-resolution structural scan, registered to standard MNI-space coordinates. CS = central sulcus; PCS = postcentral sulcus.

