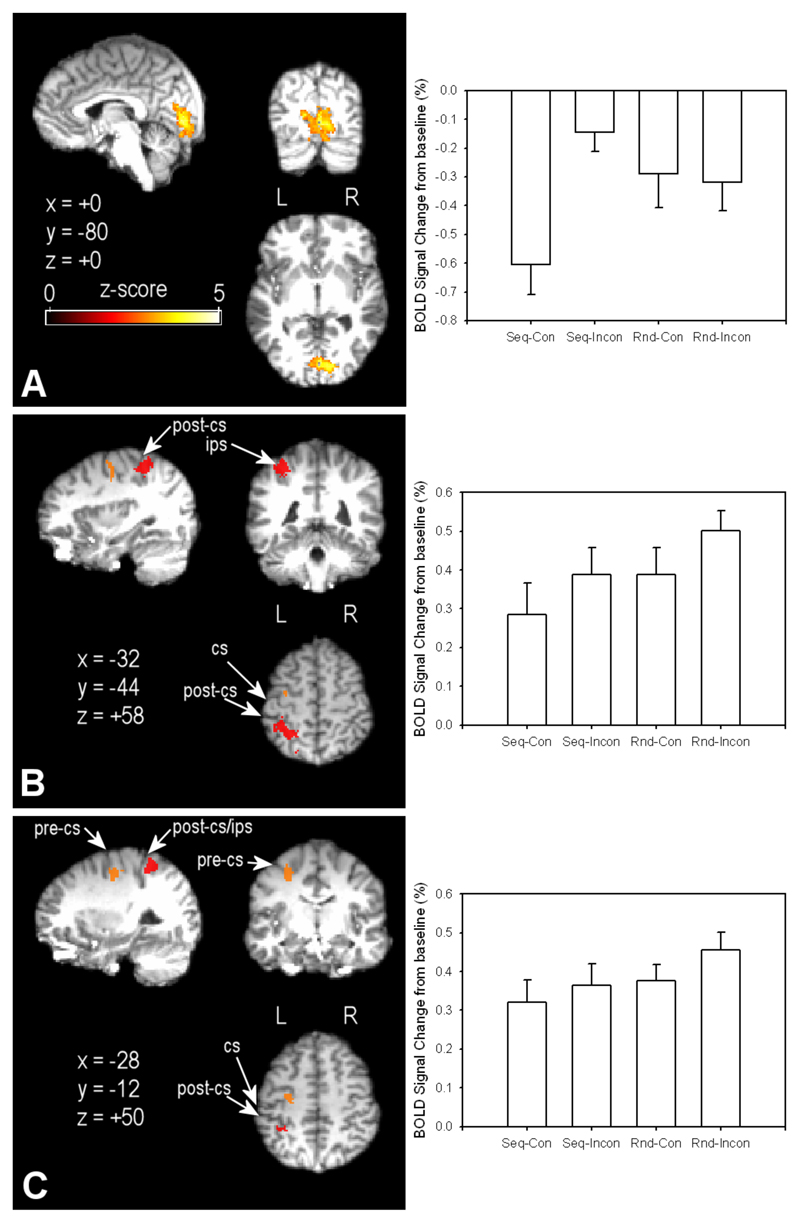
Figure 6.
Functional data are projected onto a single participant’s high-resolution structural scan, registered to standard MNI-space coordinates. Panel A: Visual cortex activation for the interaction between the Random/Sequential visual display and Incongruent/Congruent hand movement factors. Panel B: Left hemisphere superior parietal cortex activation (in red shading) for conjunction of mismatch conditions compared to sequential congruent. Red highlighted areas were significantly more active in the conjunction of the two main effects (Incongruent > Congruent, Random > Sequential). Panel C: Left hemisphere dorsal premotor cortex activation for the conjunction as noted in Panel B. CS = central sulcus; PCS = postcentral sulcus. Thresholding of contrasts was at Z > 2.6, with clusters thresholded at p < .05. Bar graphs to the right of each map show average percentage signal change in the displayed area for the four experimental conditions (Seq = Sequential; Rnd = Random; Con = Congruent; Inc = Incongruent).

