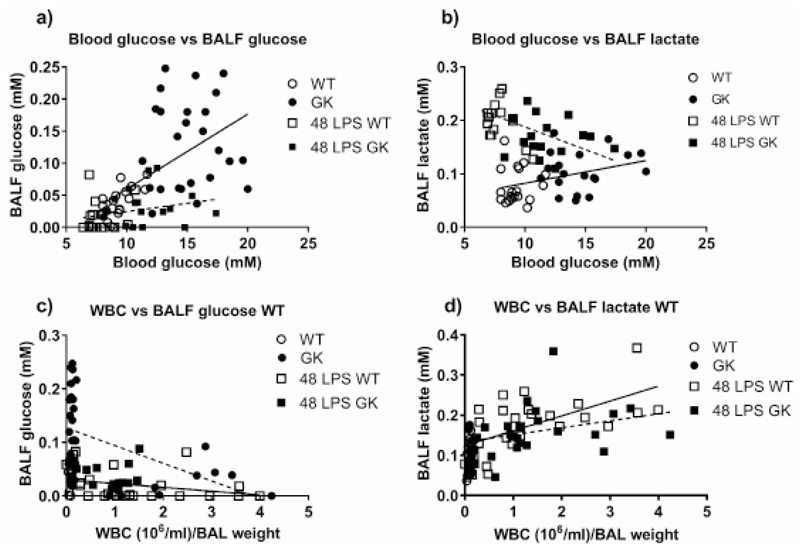
Figure 2.
Figure 2a: Relationship between Blood glucose and BALF glucose, Figure 2b: Blood glucose and BALF lactate, before (circles) and 48 hours after LPS treatment (squares) in WT (open) and GK+/- (black), respectively. Linear regression of the points before LPS treatment (WT/GK) is shown as a solid black line and after LPS treatment (48 LPS WT/GK) as a broken line. Figure 2c: Relationship between total WBC measured in BALF and BALF Glucose, Figure 2d: Total WBC in BALF and BALF lactate before (circles) and 48 hours after LPS treatment (squares) in WT (open) and GK+/- (black), respectively. Linear regression of the points from WT are shown as a solid line and GK+/- as a broken line.

