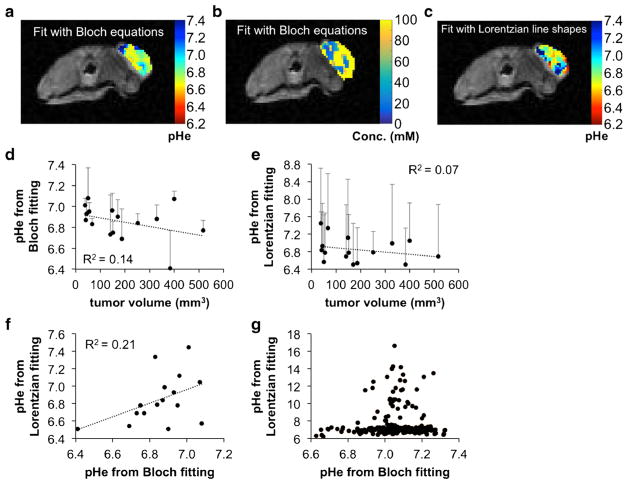
Fig. 3.
AcidoCEST MRI of the flank tumor model. a A representative parametric map of tumor pHe and of b concentration determined with Bloch fitting of the flank tumor model is overlaid on the anatomical image. c A parametric map of tumor pHe determined with Lorentzian fitting of the flank tumor model is overlaid on the anatomical image. d The flank tumor model showed a weak inverse correlation between pHe and tumor volume when analyzed with Bloch fitting, suggesting increased metabolism as the tumor grew larger. e This correlation was weaker when the pixels were analyzed with Lorentzian fitting. Error bars represent the standard deviation of the pixelwise map for a particular mouse. f When comparing the median values from the parametric pHe maps analyzed with Bloch fitting and Lorentzian fitting on a mouse by mouse basis, there was a weak positive correlation, suggesting that results from the two fitting methods were similar but not identical. g Within the same mouse, pixel values from Bloch and Lorentzian fitting were more similar when Bloch fitting estimated low pHe values compared to when Bloch fitting estimated high pHe values.

