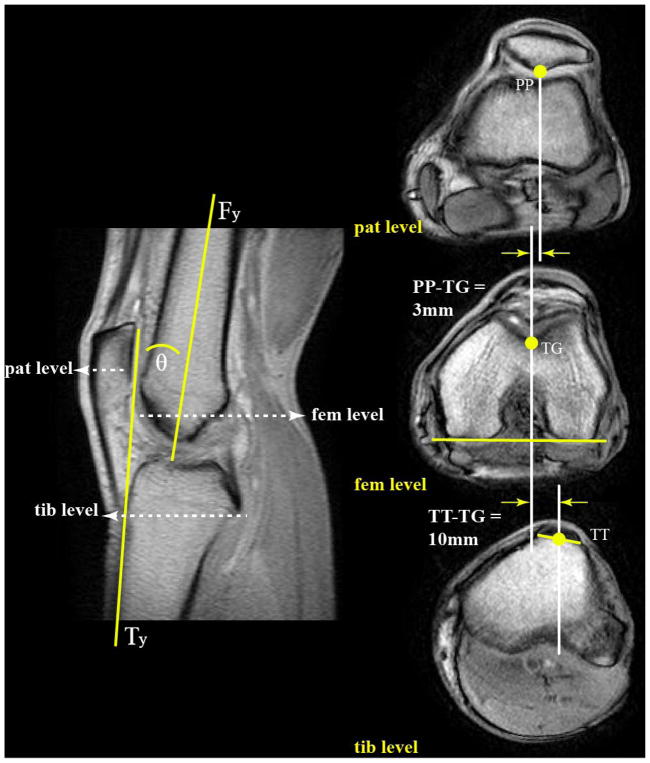
Figure 2. Key landmarks on dynamic CPC MR Images.
Left image is the full extension image from the CPC dataset for this subject. The knee angle (θ) was defined as the angle between the anterior border of the tibia (Ty) and the long axis of the femur (Fy). The three cine axial planes (pat, fem, and tib) were selected based on this image and are shown on the right (top, middle, and bottom, respectively). The location of most posterior point of the patella (PP) in the image at level of the mid-patella (top), the deepest aspect of femoral sulcus (TG) in the image representing the widest aspect of the femoral epicondyles (middle), and the midpoint of the patellar tendon in the image containing complete insertion onto the TT (bottom) were identified. Using the tracking data from the CPC analysis, the knee angle and these points were tracked throughout the motion cycle. These data, in turn, were used to quantify the TT-TG distance and the distance from TG to PP throughout the motion cycle.

