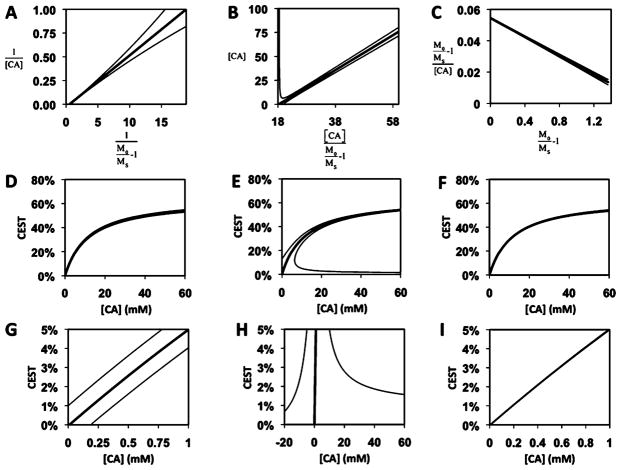
FIGURE 3.
The (A) Lineweaver–Burke-like CEST plot, (B) Eadie–Hofstee-like CEST plot, and (C) Hanes-like CEST plot were simulated for a CEST agent that generates 5% CEST at 1 mM concentration. The thick line shows the case with no systematic error, and the thin lines represent the effect of adding +1% or −1% to the CEST measurement. (D–F) A CEST–concentration calibration can be constructed from each of these linear relationships. (G–I) The same CEST–concentration calibrations as graphs D–F, but ranging from 0 to 1 mM. These graphs show that the calibration is most accurately determined from the Hanes-like CEST plot, because the thick and thin lines are indistinguishable in graph I.

