Fig. 2.
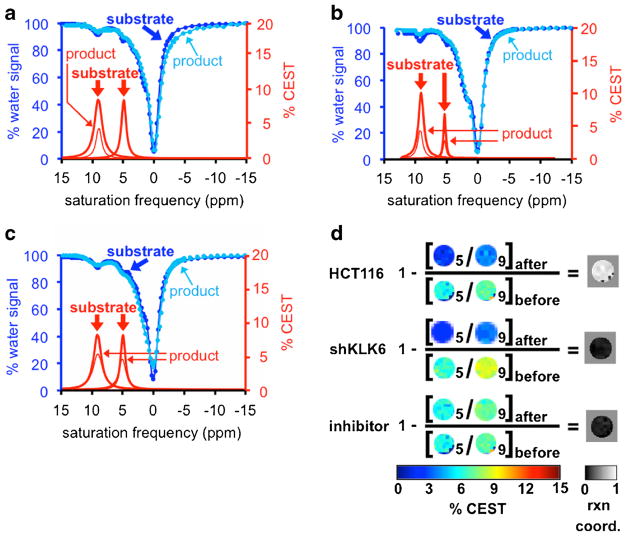
CatalyCEST MRI of KLK6 activity in vitro. a Incubation of the substrate in HCT116 cell media with high KLK6 expression caused the CEST signal at 5.3 ppm to disappear. The decrease in CEST signal at 9.5 ppm was attributed to sample dilution. b Incubation of the substrate in shKLK6 cell media with low KLK6 expression, and c Incubation in HCT116 cell media pre-treated with inhibitor, each did not cause the CEST signal at 5.3 ppm to disappear while the decrease in both CEST signals was attributed to sample dilution. d Parametric maps of the CEST signal amplitudes were used to visualize the KLK6 enzyme reaction coordinate. Images labeled as “5” represent the CEST signal amplitude at 5.3 ppm, and images labeled as “9” represent the CEST signal amplitude at 9.5 ppm.

