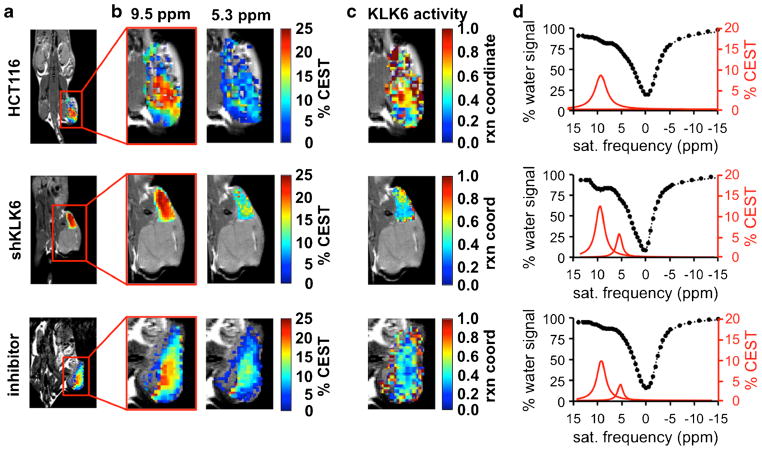
Fig. 4.
CatalyCEST MRI of KLK6 activity in vivo. a Anatomical images showed the locations of flank tumors in the HCT116 model, the shKLK6 model, and the HCT116 model treated with inhibitor. b The CEST signal amplitudes of the tumors after saturation at 9.5 or 5.3 ppm were overlaid on anatomical images. c These CEST signal amplitudes and Eq. [2] were used to determine parametric maps of the reaction coordinate of KLK6 activity. d CEST spectra (black) and Lorentzian line shapes (red) show the average CEST signal amplitudes within the tumors. For comparison, Fig. S6 shows similar results from all mice tested in this study. Fig. S7 shows the parametric maps of the CEST signals from the tumor and tissues surrounding the tumor.

