
Figure 2. Genetic Aberrations That Distinguish Genetic Subtypes of DLBCL.
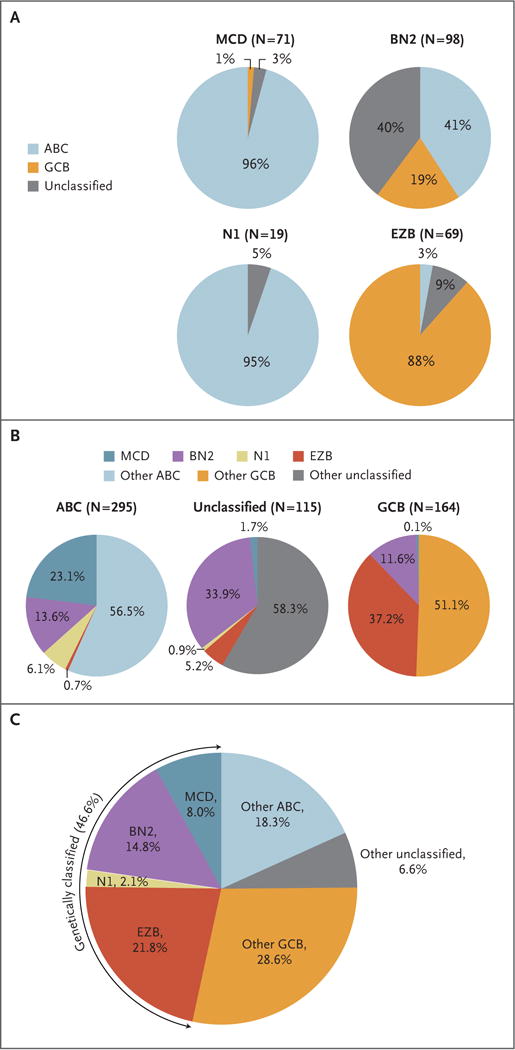
Panel A shows the distribution of gene-expression subgroups within genetic subtypes, termed MCD (based on the co-occurrence of MYD88L265P and CD79B mutations), BN2 (based on BCL6 fusions and NOTCH2 mutations), N1 (based on NOTCH1 mutations), and EZB (based on EZH2 mutations and BCL2 translocations). Panel B shows the distribution of genetic subtypes within gene-expression subgroups. In Panels A and B, the number of cases of DLBCL is shown in parentheses. Panel C shows the predicted prevalence of the indicated DLBCL subsets in a population-based cohort.9