
Figure 3. Gene-Expression Signatures That Distinguish the DLBCL Genetic Subtypes.
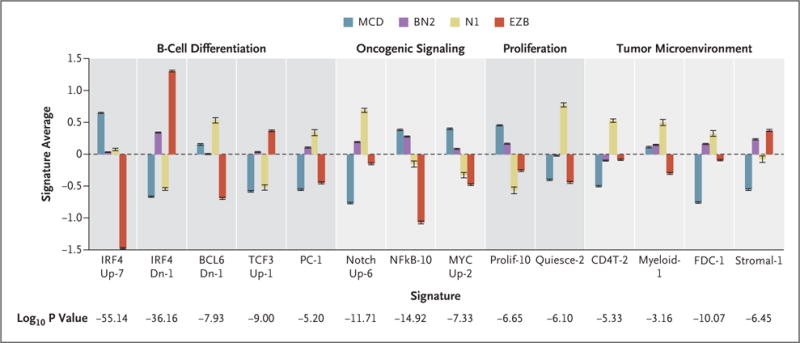
The mean values of the indicated signature averages for cases assigned to each genetic subtype are shown. A full annotation of these signatures is available in Figure S3 in Supplementary Appendix 1 and at https://lymphochip.nih.gov/signaturedb/. P values were calculated with the use of an F-test. I bars indicate standard errors.