
Figure 5. Genetic Aberrations Targeting Oncogenic Signaling Pathways in DLBCL.
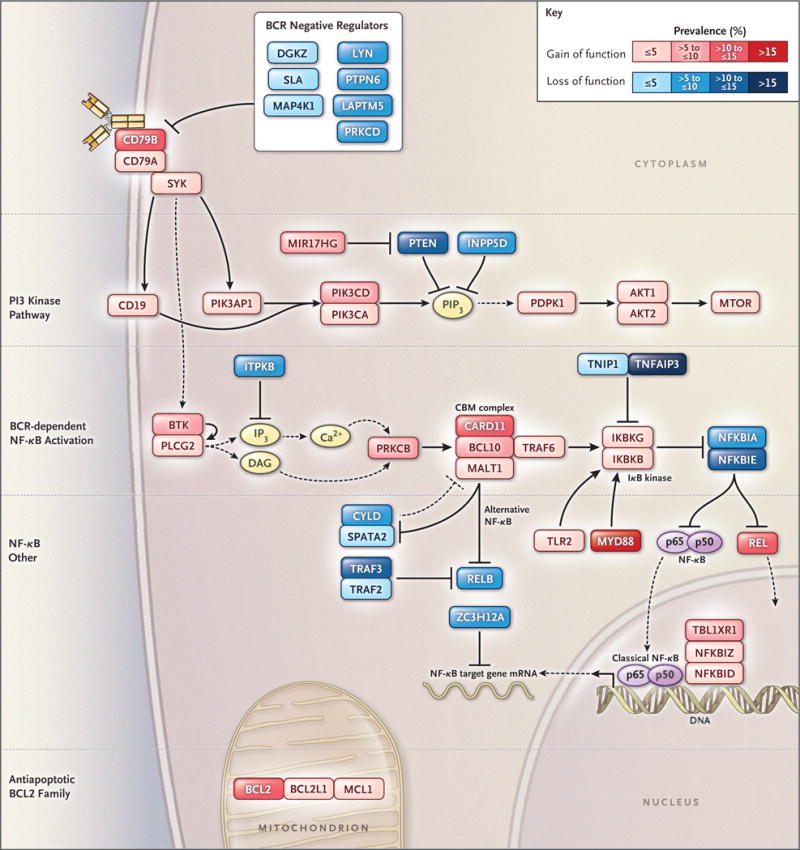
Shown is the prevalence of putative gain-of-function or loss-of-function genetic aberrations targeting genes in each indicated oncogenic signaling category. The prevalence of genetic aberrations is indicated by the color scale shown. Genetic aberrations included for each gene are indicated in Figure S5B in Supplementary Appendix 1. BCR denotes B-cell receptor, CBM complex CARD11–BCL10–MALT1 signaling adaptor complex, mRNA messenger RNA, and NF-κB nuclear factor κB.