
Fig. 2.
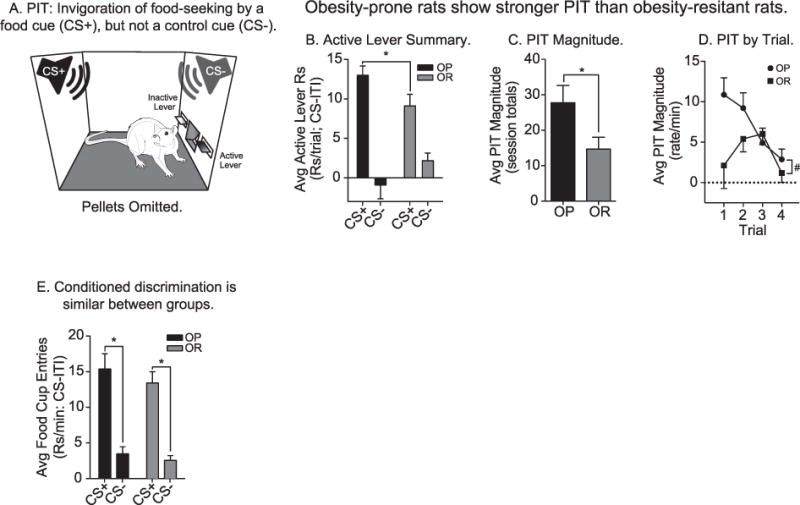
PIT testing: Obesity-prone rats show stronger PIT than obesity-resistant rats. A) Schematic of Pavlovian-to-instrumental transfer test, a measure of cue-triggered food-seeking and incentive motivation (OP n = 20; OR n = 19). B) Average active lever responding above baseline in the presence of the CS+ and CS−. The average rate of responding on the active lever was greater during CS+ vs. CS− in both groups. However, the obesity-prone group responded more vigorously during CS+ presentations than the obesity-resistant group. C) The average magnitude of PIT (i.e., the difference in active lever responding during CS+ vs. CS− presentations) was greater in obesity-prone vs. obesity-resistant rats. D) The average magnitude of PIT across trials was greater in the obesity-prone vs. the obesity-resistant group. The obesity-prone group exhibited classic, robust PIT, which is most prominent in early trials, but slowly declines across repeated CS presentations, whereas the obesity-resistant group showed weak PIT that was variable, and short-lived. E) Conditioned discrimination during PIT testing was present in both groups, with rats preferentially entering the food cup during CS+ vs. CS− presentations. The rate of responding during CS+ and CS− presentations and the magnitude of discrimination was similar between the groups. All data shown as average rate of responding above baseline (ITI) ± SEM; * = p < .05; # = Main effect of group, p < .05.