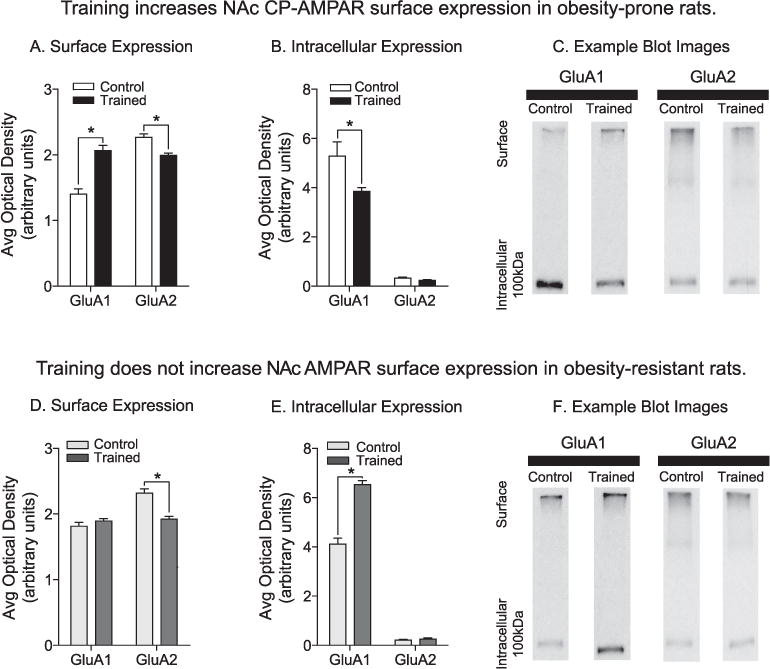
Fig. 3.

Experience during training increases NAc CP-AMPAR surface expression in obesity-prone, but not obesity-resistant rats. A) Average surface expression of GluA1 and GluA2 subunits in obesity-prone groups: Relative to the Control group (white bars), surface GluA1 expression was increased, whereas surface GluA2 expression was decreased following training (black bars). This pattern is consistent with an increase in GluA2-lacking CP-AMPARs. B) Average intracellular expression of GluA1 and GluA2 subunits in obesity-prone groups. Intracellular GluA1 levels were decreased following training in obesity-prone rats. C) Representative images of GluA1 and GluA2 expression in crosslinked NAc tissue from obesity-prone groups. D) Average surface expression of GluA1 and GluA2 subunits in obesity-resistant rats. GluA1 surface expression did not differ between Control (light gray bars) and Trained (dark gray bars) groups, but GluA2 surface expression was decreased in the Trained vs. Control groups. E) Average intracellular expression of GluA1 and GluA2 subunits in obesity-resistant rats. Intracellular GluA1 expression was increased following training, with no differences observed in intracellular GluA2 expression. F) Representative images of GluA1 and GluA2 expression in crosslinked NAc tissue from obesity-resistant groups. OP-Trained n = 10; OP-Control n = 6; OR-Trained n = 10; OR-Control n = 6; * = p < .05.
