
Figure 7. TIL dysfunction in lung cancer is linked to Tex cell phenotypes shared with severe HIV and tissue-associated features.
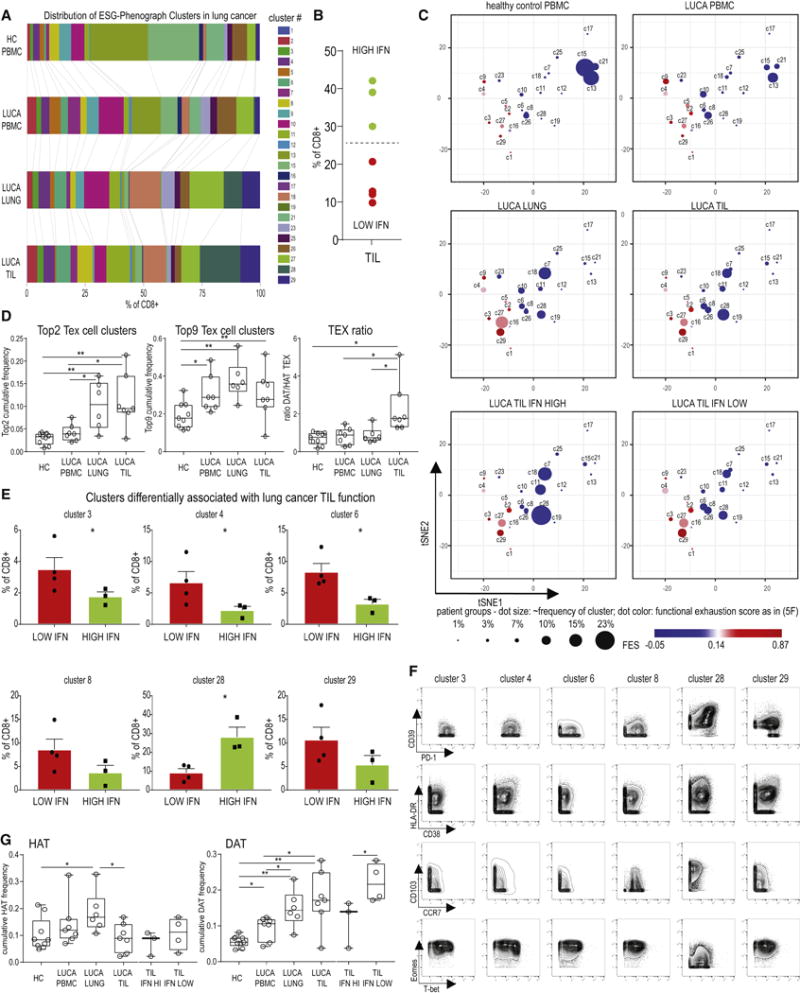
(A) Distribution of phenograph clusters in the blood, uninvolved lung tissue and tumor from 7 lung cancer patients and HC. The mean frequency of each cluster in each patient population is indicated by the size of the corresponding bar. (B) Tumors were evaluated based on CD8 TIL IFN-γ production following overnight anti-CD3 stimulation, and stratified into high and low TIL functionality. (C) The relative frequency of each cluster is shown on the same exhaustion coordinate system as in Figure 6D and Supplementary Figure 6. (D) Sum of the frequencies for the Top 2 and Top 9 Tex cell clusters and TEX ratio were determined as defined in Figure 6. (E) Clusters overrepresented in low or high functionality TIL are shown (for stacked bar analysis see Supplementary Figure 5). * indicates p <0.05. c8: p=0.07; c29: p=0.08. (F) Bivariate plots indicate expression of markers of exhaustion, activation, tissue residency and transcriptional programming for clusters differentially linked to tumor functionality. Plots display concatenated CD8 T cell data from lung cancer patients and HC as assigned by phenograph clustering. (G) The sum of the frequencies of HAT or DAT clusters linked to mild or severe HIV was determined in the lung cancer cohort. TIL data was analyzed both as total aggregate data and separating the high and low functionality samples as shown in (B). DAT clusters enrich in the dysfunctional tumor microenvironment in lung cancer.