Fig. 4.
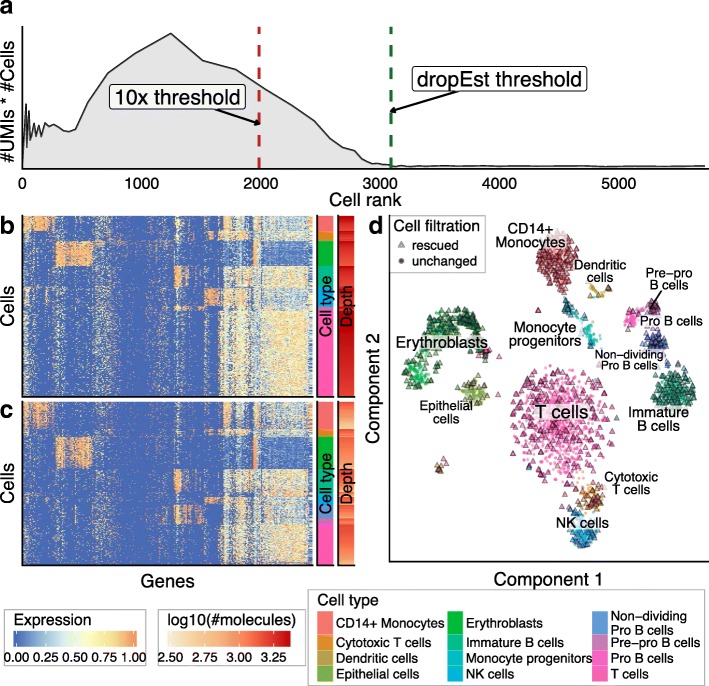
Selection of the optimal size threshold for the 10x BMMC dataset. These plots show comparison of dropEst and 10× Cell Ranger strategies for initial selection of number of real cells in the 10x BMMC dataset (dataset 8). a The distribution of molecular mass across CBs of different sizes. The y-axis shows the number of UMIs per cell multiplied by the number of cells with a similar number of UMIs. The cells are ranked by their size (number of UMIs), with the largest cells positioned near 0 (see “Methods”). Such “molecular mass” plots can be used to estimate the number of real cells in a dataset. Here, the peak centered around x = 1200 represents real cells. The vertical dashed lines show size-based thresholds, as determined by Cell Ranger (red) and dropEst (green). dropEst threshold admits 1105 additional cells. b The heatmap shows gene expression profiles of cluster-specific genes for the cells that were admitted by both 10x and dropEst thresholds. Expression levels of different genes (columns) are shown by color. Cells (rows) are grouped by cluster (see cluster bar on the right), and then ordered descending by number of molecules (the depth bar on the right). Genes (rows) were clustered using hierarchical clustering. See “Methods” for details. c Similar to b, the heatmap shows expression of the same genes in the set of an additional 1105 cells admitted by the dropEst threshold procedure. The additional cells show expression patterns consistent with their assigned clusters. d t-SNE visualization of the 10x BMMC dataset. All cells which pass both Cell Ranger and dropEst thresholds are shown as circles. Cells which were admitted only with the dropEst threshold are shown as triangles

