Fig. 5.
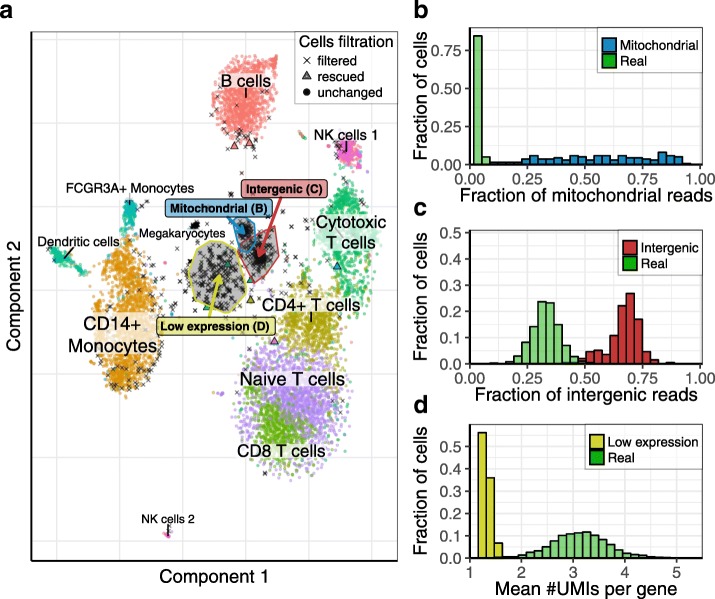
Filtration of low-quality cells for the 10× 8k PBMC dataset. This figure shows the result of the KDE-based algorithm for the filtration of low-quality cells on the 10× 8k PBMC dataset (dataset 13). a t-SNE visualization of the cell subpopulations; only cells which either passed the size threshold or have a quality score > 0.9 are shown. Cells passing the dropEst size threshold and having a quality score ≥ 0.1 are shown with circles. A few cells falling below the size threshold but with a high (> 0.9) quality score are shown with triangles. Cells passing the size threshold but with a low (< 0.1) quality score are considered as filtered and are shown with black crosses. Most filtered cells originated form three distinct clusters, marked by a high fraction of intergenic or mitochondrial reads and a low number of reads per UMI (see labels). b–d Distributions of distinguishing characteristics (x-axes) are compared between clusters of low quality cells and the real cell population. Here, we consider a cell to be real if it passes the size threshold and has a quality score > 0.9

