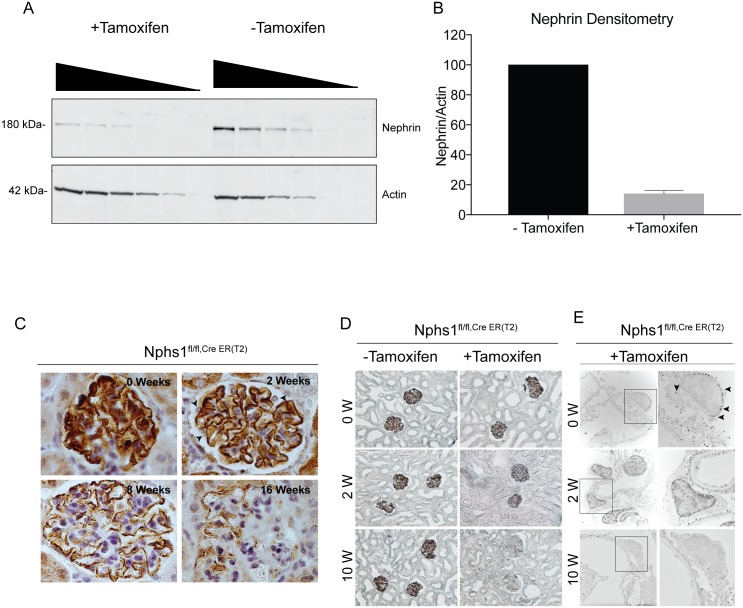
Fig 2. Induced model of nephrin deletion in podocytes.
(A) Western blot showing decrease in nephrin in glomerular lysates from Nphs1fl/fl,iCre(ER)T2 mice kidneys 14 weeks post-induction with tamoxifen. Decreasing amounts of lysate volume were loaded in each well to avoid reaching the threshold of the x-ray film. Actin is used as loading control. (B) Densitometry showing quantification of the decrease in total nephrin following deletion. Results are representative of 4 separate experiments. (C) Immunoperoxidase staining for nephrin at various time points following tamoxifen-induction. Arrowheads show loss of cytoplasmic nephrin staining in podocytes at 2 weeks. (D) Light microscopy images of kidney tissue sections following silver enhancement of immunogold particles. (E) Immunogold electron microscopy of mouse kidney sections at 2 weeks and 10 weeks showing gold particles (arrowheads) at the slit diaphragm and within the cell body. Gold particles are seen primarily at the slit diaphragm in Nphs1fl/fl,Cre+ at 10 weeks. Right panel shows enlarged images of the boxed areas in the left panel. Images were taken at X12,200 and cropped to emphasize the immunogold particles.

