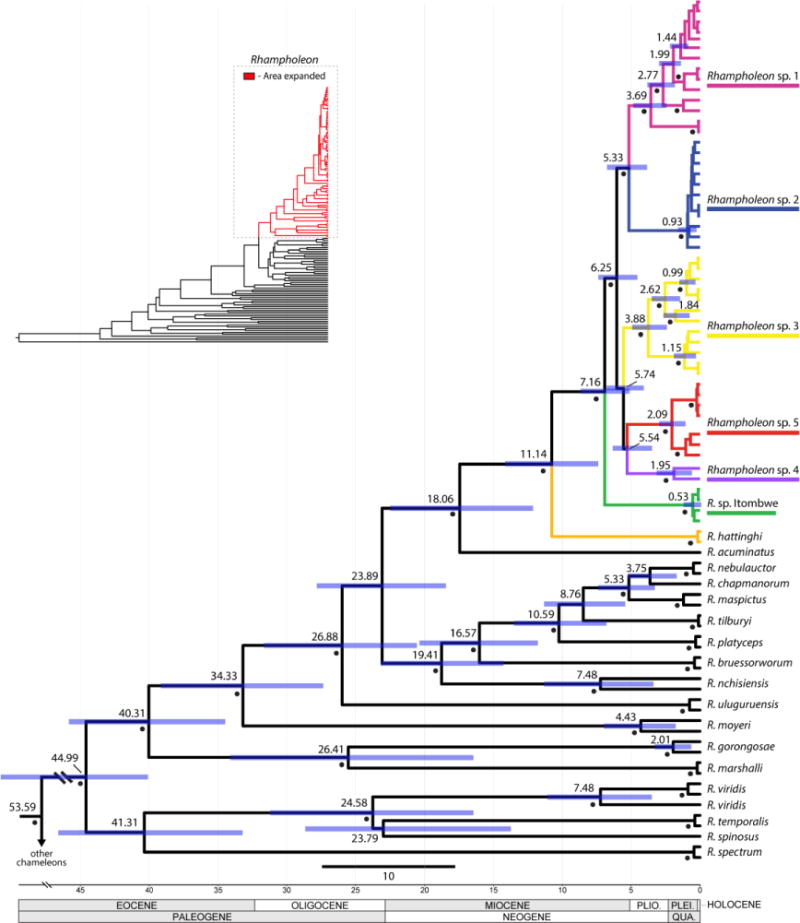
Figure 4.

Bayesian chronogram of the pygmy chameleon genus Rhampholeon. Posterior probabilities ≥ 95% are denoted by filled circles adjacent to nodes. Numbers near nodes denote mean highest posterior densities (HPD) and blue bars at nodes represent 95% HPD.
