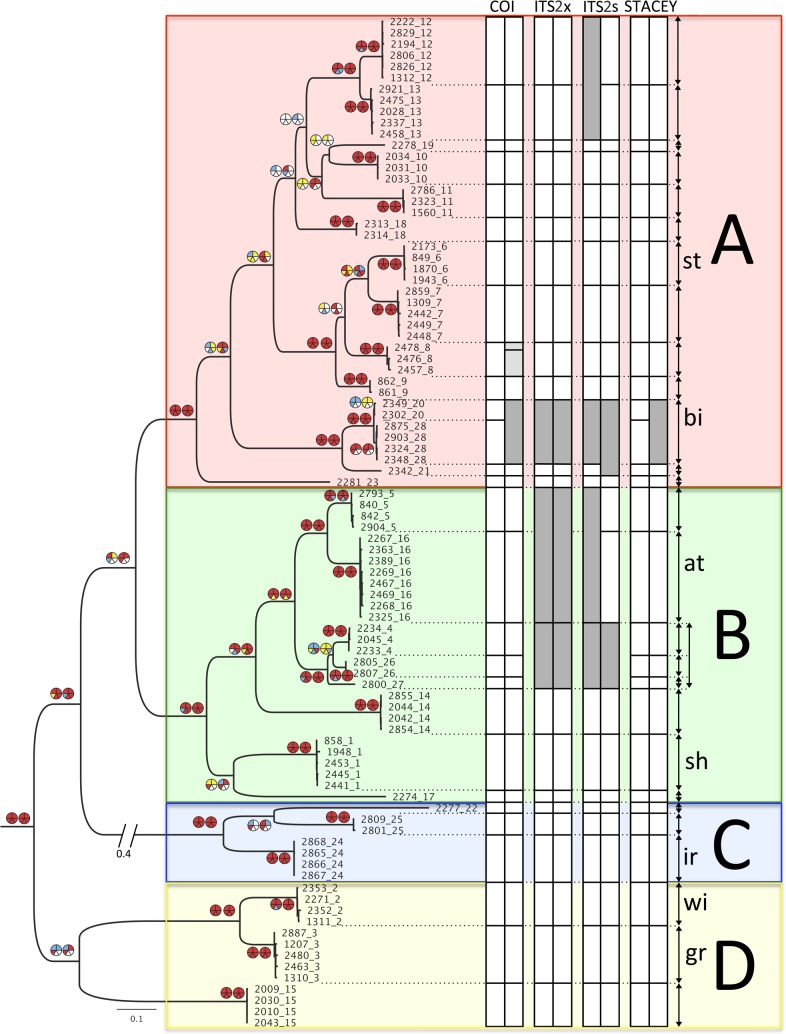
Fig 5. Results from the phylogenetic analyses, summarized on the ML estimate of the combined data set with xinsi-aligned ITS2-sequences including 91 terminals.
Specimens are named according to the extraction-number and the appended clade-number. The phylogenetic tree is arbitrarily divided into four colour-coded groups, A–D. These colours are used as background colour in the distribution and haplotype network figures (Figs 6–8). Specimens with at least three of the genetic markers were included in the phylogenetic analyses, outgroups are not shown. Pie diagrams indicate support values for the node, left pie shows results from ML analyses, and right pie diagram results from Bayesian analyses. Upper two slices of a pie illustrate results from the combined data sets' two different alignments, with xinsi-aligned ITS2-sequences to the left, and salsa-aligned ITS2-sequences to the right. The three remaining slices illustrate results from the combined mitochondrial data (lower left slice), and the combined nuclear data sets' two different alignments, where lower median slice has xinsi-aligned ITS2-sequences, and lower right slice has salsa-aligned ITS2-sequences. Yellow, blue and red colour indicate low, moderate and strong support, which equals ML support in the intervals 50–74, 75–89, and 90–100, or BI posterior probabilities in the intervals 0.50–0.84, 0.85–0.94 and 0.95–1.0 respectively. White means support <50/0.50 for the node. Columns show clustering of terminals according to different methodologies performed on more inclusive data sets where all specimens with COI or ITS2 data, or specimens with both COI and ITS2 data, were included. The first columns under the headings COI, ITSx and ITSs represent the results from TCS, and the second columns represent the results from GMYC. The columns under the heading STACEY show the two different outcomes from this analysis. White means that the network or species recovered is identical to the initial haplotype network found in COI including all COI-sequences, light grey means that less inclusive networks or putative species were recovered, and dark grey means that a more inclusive network or putative species was recovered. Double-headed arrows to the right of the columns show our final judgement of species delimitation. The two small letters to the right indicate our designation of described species, st = T. stroemii, bi = T. bigeniculatus, at = T. atlantis, sh = T. shetlandica, ir = T. irinae, wi = T. williamsae, and gr = T. gracilis.

