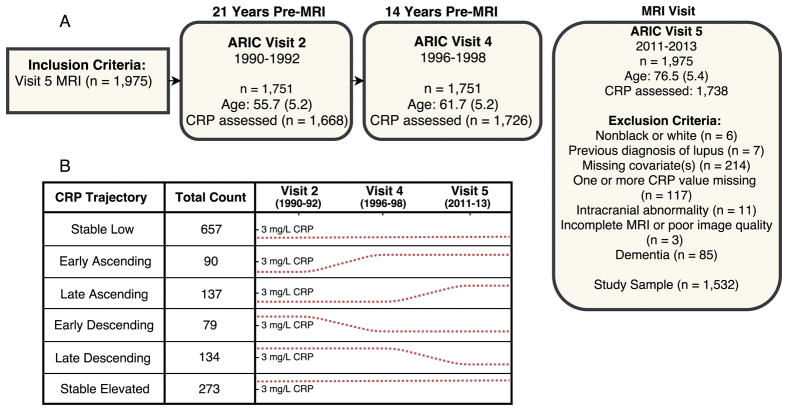
Figure 1. Study flowchart and C-reactive protein trajectory grouping.
(A) Study design and primary inclusion and exclusion criteria. (B) Participants were assigned to one of six C-reactive protein (CRP) trajectory groups based on CRP levels at Visits 2, 4, and 5. The dotted line denotes CRP levels at each time-point. A line above the tic mark indicates a CRP level ≥3 mg/L.

