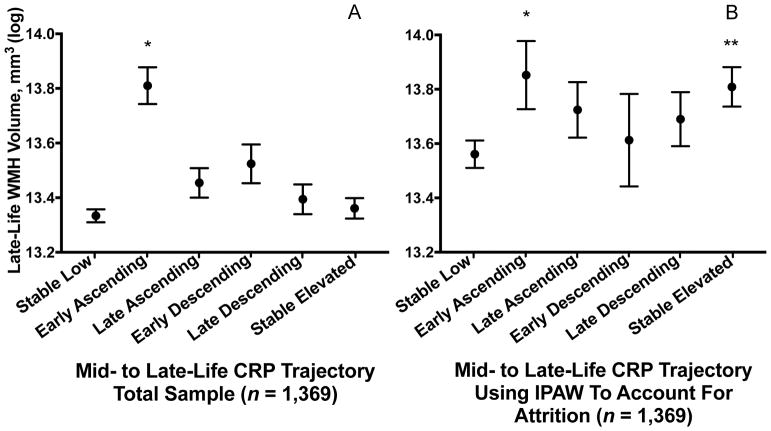
Figure 2. Late-life white matter hyperintensity volume according to 21-year C-reactive protein trajectory.
Estimated late-life total white matter hyperintensity volume according to the trajectory of C-reactive protein levels from mid- to late-life in the (A) primary analysis and (B) after accounting for differential attrition due to death and drop-out using inverse probability of attrition weighting. Models are adjusted for age, sex, race-center, education, cigarette smoking and alcohol use status, BMI, total cholesterol, HDL, hypertension, diabetes, coronary heart disease, previous cancer, inflammatory disease, anti-inflammatory medication use, and APOE ε4 status.
*P < .05; ** P < .01 difference between group and the Stable Low (referent) group
Abbreviations: IPAW = inverse probability of attrition weighting; WMH = white matter hyperintensity.

