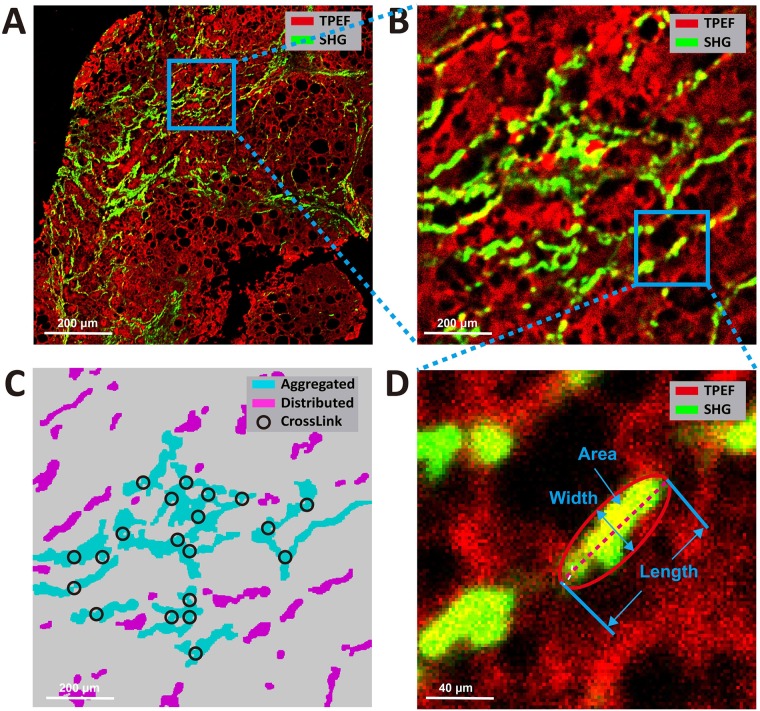
Fig 3. Illustration of collagen parameters on SHG microscopy.
A) The RAW SHG/TPEF image. (B)The high magnification imaging performed in the area delimited by the blue square in picture A. (C) The aggregated and distributed strings of picture B. (D) The high magnification imaging performed in the area delimited by the blue square in picture B, and illustration of the width, length and area of a string. The thick string is by definition length-width ratio > 0.25.

