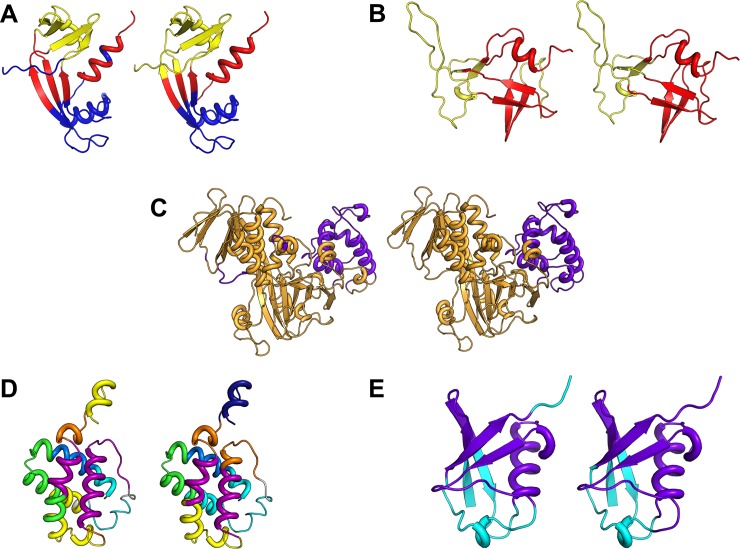
Fig 3. Comparison of communities from MD and GNM.
Mapped communities for five proteins. (A) Angiogenin (PDB ID: 1agi), (B) Protease (PDB ID: 1nso), (C) Guanine nucleotide dissociation inhibitor (PDB ID: 1gnd), (D) Hemoglobin (PDB ID: 1idr), (E) Ubiquitin (PDB ID: 1ubq). The number of communities (Nc) shown for each case corresponds to the case of maximum agreement between MD and GNM given by Kappamax. DCCGNM calculated with a subset of 20 low-frequency modes was used for each protein to perform calculations for communities.

