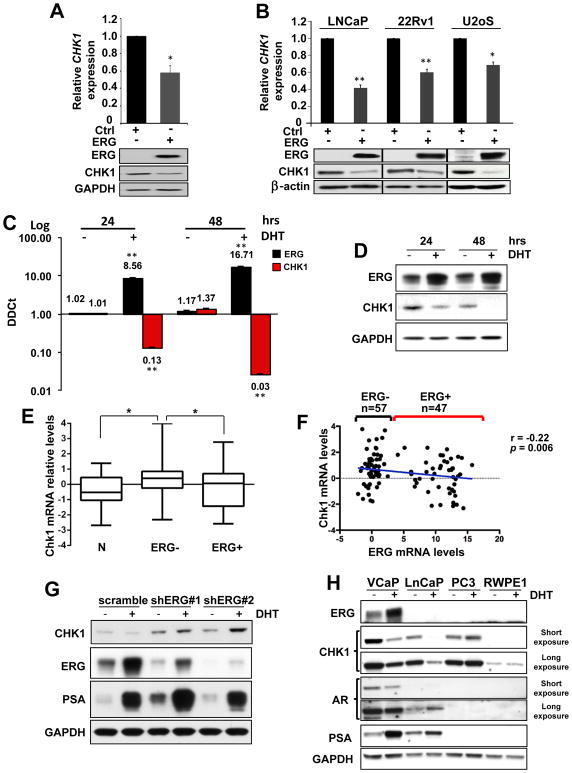
Figure 1. CHK1 downregulation upon ERG overexpression.
A, RT-qPCR and Western blot analyses showing reduction in CHK1 levels in response to overexpression of ERG in 293 cells. B, CHK1 mRNA and protein downregulation 24 hours following overexpression of ERG in the indicated cell lines. C, Increasing amount of ERG transcript in the VCaP cells inversely correlates with CHK1 mRNA levels after 24 and 48 hours of DHT (10 nM) treatment. D, ERG and CHK1 protein levels in samples described in C. E, Box plot showing mean, standard deviation and range of z-scores of CHK1 expression in normal prostate tissue (N), ERG positive (ERG+) or ERG negative (ERG-) prostate tumors. P < 0.05 calculated using two-tailed t-test. F, Dot plot of CHK1 mRNA expression versus ERG mRNA expression. Each dot represents an individual patient. A blue line shows the linear regression of the data. The slope of the line is significantly non-zero (r=−0.022, p=0.006). Error bars in bar graphs indicate mean±s.d. G, Western blot analysis of ERG, CHK1, and PSA in VCaP cell line transduced with two independent shRNAs targeting ERG and treated for 24 hours with 10 nM DHT. VCaP cells transduced with a scramble shRNA sequence were used as control. H, Western blot analysis of ERG, CHK1, AR, PSA, in VCaP, LNCaP, PC3, RWPE1 prostate cell lines after 24 hours of DHT (10 nM) treatment. GAPDH was used as loading control. Error bars indicate mean±s.d. Experiments were performed in triplicate, data were analyzed using unpaired t-test. Values of P < 0.05 were considered statistically significant (*p<0.05, **p<0.01).

