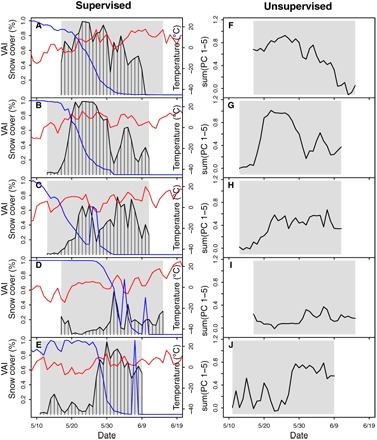
Fig. 2. Songbird community vocal activity estimated by supervised and unsupervised approaches.

(A to E) Songbird daily VAI, snow cover (blue), and air temperature (red) near TLFS between 2010 and 2014. (F to J) Weighted sums of the first five principal components at the same site and time. Gray boxes identify the available recording period for acoustic data. Daily VAI and weighted sums for the entire data set at all field sites can be found in the Supplementary Materials (figs. S3 to S5).
