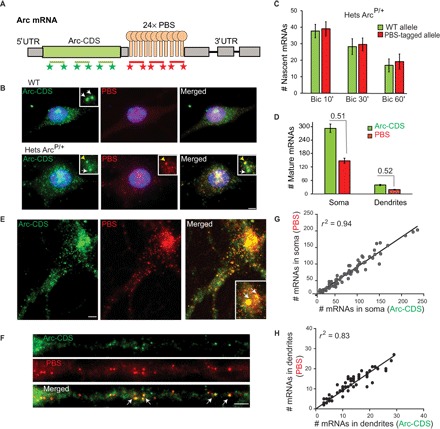
Fig. 2. PBS tagging does not affect Arc transcription and mRNA stability.

(A) smFISH probes against Arc-CDS and PBS linkers (PBS) to detect mature full-length PBS-tagged Arc mRNAs. (B) Detection of WT and PBS-tagged allele in WT mouse (top) and heterozygous ArcP/+ mouse (bottom) by smFISH with Arc-CDS and PBS probes in bicuculline (Bic)–stimulated neurons. Inset shows transcription sites. Arrows indicate untagged WT allele; yellow arrowhead indicates PBS-tagged allele. (C and D) Quantification of Arc transcripts produced from WT and PBS-tagged allele, as detected by smFISH in neurons from ArcP/+ mouse after bicuculline stimulation. Graphs represent (C) nascent Arc mRNAs produced at transcription sites at different time points after stimulation (n = 40 neurons for Bic 10′, n = 20 for Bic 30′, n = 15 for Bic 60′; no significant differences, P > 0.05 for all conditions) and (D) mature full-length mRNAs in soma and in dendritic segments (up to 100 μm from soma) in ArcP/+ mouse. Ratios of PBS-tagged mRNAs to total Arc mRNAs are shown in (D). Nonsignificant difference from expected 0.5 value (P = 0.60, n = 49 for soma; P = 0.37, n = 45 for dendrites). (E and F) Detection of full-length Arc mRNAs by two-color smFISH with Arc-CDS and PBS probes in ArcP/P mouse. White arrows indicate PBS-tagged Arc alleles in inset (E), and colocalization of CDS and PBS FISH spots in dendrites (F). (G and H) Correlation between the number of mature cytoplasmic mRNAs detected by Arc-CDS and PBS smFISH in the soma (G) and in the dendrites (H) of ArcP/P neurons, indicated by Pearson’s coefficient (r2) (n = 71 for soma, n = 39 for dendrites). Error bars represent SEM. Scale bars, 5 μm.
