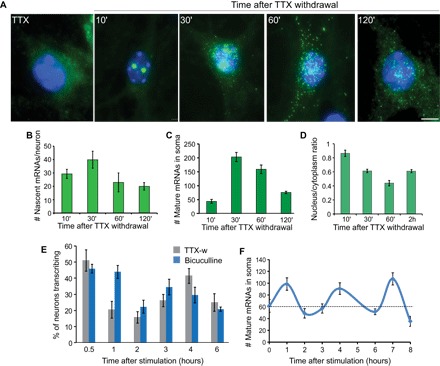
Fig. 3. Time course of Arc transcription in ArcP/P mouse neurons after stimulation.

(A) Hippocampal neurons were treated with TTX (1.5 μM) for 12 to 16 hours, followed by release from TTX, and then fixed at different time points for smFISH using probes against the PBS linkers. Transcription from both alleles was observed. (B to D) Graphs representing the time course of average number of nascent transcripts produced at both transcribing alleles (B), average number of mature mRNAs in the soma (C), and the nuclear/cytoplasmic ratio of mRNAs in soma (D). (E) Percentage of Arc-transcribing neurons at different time points following TTX withdrawal (TTX-w) and bicuculline treatment (n = 3 independent experiments, 70 to 80 neurons each time point). (F) Average number of Arc mRNAs in the soma after bicuculline stimulation. Black dashed line indicates average number of mRNAs in the basal condition (n = 40 to 50 neurons per time point). Error bars represent SEM. Scale bar, 5 μm.
