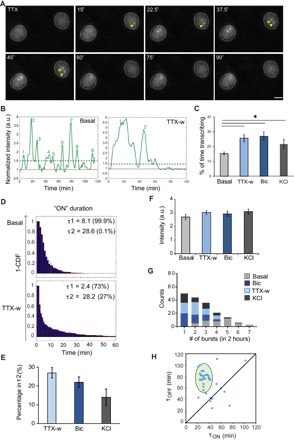
Fig. 4. Real-time measurements of activity-dependent transcription dynamics of Arc.

(A) Snapshots of Arc-transcribing alleles, before and after TTX withdrawal (time in minutes). Green and yellow arrowheads indicate transcription from a single and both Arc alleles, respectively. (B) Intensity profiles of transcription sites under basal and stimulated conditions. Solid line indicates the baseline normalized to the nuclear background. Dashed line indicates the threshold for transcriptional burst (ON state). Numbers indicate the count of transcriptional bursts. a.u., arbitrary units. (C) Percentage of time in the actively transcribing state within the 2-hour time window for basal and stimulated conditions (*P < 0.05, two-tailed t test). (D) Inverse cumulative probability distribution of active (ON) duration of Arc transcription fitted to a two-component model, showing two time constants: τ1 and τ2. Percentage of events belonging to either τ1 or τ2 is indicated. CDF, cumulative distribution function. (E) Percentage of events in τ2 duration using different stimulation paradigms. (F) Amplitude of transcriptional burst. (G) Frequency histogram of transcriptional bursts in 2-hour time window. (H) Graph representing the relationship of OFF duration (τOFF) following an ON duration (τON ≥ τ2) in neurons after stimulation. Shaded ellipse indicates means ± 2 SDs (n = 36 alleles). Error bars for all panels indicate SEM (n = 37 cells for basal, 41 for TTX-w, 30 for Bic, and 32 for KCl from three independent experiments). Scale bar, 10 μm.
