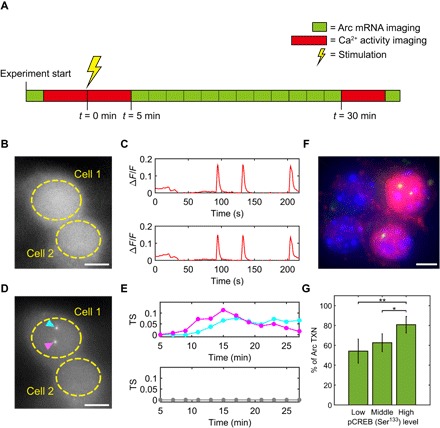
Fig. 5. Dual-color imaging of Ca2+ activity and Arc transcription in live neurons.

(A) Experimental scheme of measuring both Ca2+ activity and Arc transcription from the same neuron. One green block represents one z scan through the nucleus to detect Arc transcription sites in the green channel. One red block represents continuous imaging of Ca2+ activity at the mid-plane of the nucleus for ~5 min in the red channel. The same neuron was monitored before and after the stimulation by 50 μM bicuculline. (B) Representative Ca2+ image from the red channel. (C) Synchronized Ca2+ spikes measured from the soma (area within dashed line) of cell 1 (top) and cell 2 (bottom) 5 min after bicuculline stimulation. (D) Representative image of Arc transcription in the same neurons as shown in (B). Transcription from both alleles in cell 1 (cyan and magenta arrowheads) versus no transcription site in cell 2. (E) Time course plot of Arc transcription site (TS) intensity in cell 1 (top) and cell 2 (bottom). (F) Representative image of smFISH-IF showing Arc transcription (green) and pCREB (red) in the nucleus [4′,6-diamidino-2-phenylindole (DAPI), blue]. (G) Probability of Arc transcription (TXN) in neurons grouped by pCREB levels in the nucleus. **P < 0.01, *P < 0.05, two-tailed t test. A total of 203 neurons were imaged from four independent experiments. Error bars represent SEM. Scale bars, 5 μm.
