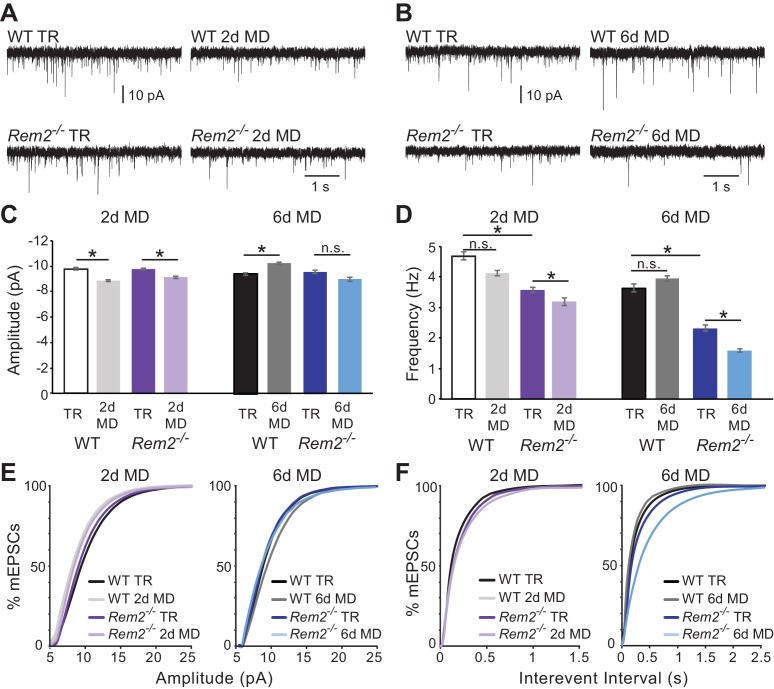
Figure 5. Rem2 is required for postsynaptic strengthening following 6 days of monocular deprivation.
(A) Representative whole-cell voltage clamp recordings of mEPSCs from layer 2/3 pyramidal neurons in binocular visual cortex (V1b) of wildtype typically reared mice at P28 (WT TR), wildtype mice undergoing 2 days of monocular deprivation (WT 2d MD), Rem2-/- typically reared mice at P28 (Rem2-/- TR), or Rem2-/- mice following 2 days of monocular deprivation (Rem2-/- 2d MD). (B) Representative voltage-clamp traces from layer 2/3 pyramidal neurons from V1b of wildtype typically reared mice at P32 (WT TR), wildtype mice undergoing 6 days of monocular deprivation from P26-P32 (WT 6d MD), Rem2-/- typically reared mice at P32 (Rem2-/- TR) or following 6 days of MD (Rem2-/- 6d MD). (C) Average mEPSC amplitude recorded from wildtype or Rem2-/- layer 2/3 pyramidal neurons with normal visual experience at (left) P28 (WT TR, white, n = 25; Rem2-/- TR, dark purple, n = 29), or following 2 days of monocular deprivation (WT DR, light gray, n = 25; Rem2-/- 2d MD, light purple, n = 23) or (right) at P32 with normal visual experience (WT TR, black, n = 24; Rem2-/- TR, dark blue, n = 24) or following 6 days of monocular deprivation (WT 6d MD, gray, n = 25; Rem2-/- 6d MD, light blue, n = 25). N = 4 animals per experimental condition. (D) Average mEPSC frequency in wildtype and Rem2-/- mice undergoing 2 days (Left) or 6 days (Right) of monocular deprivation compared to typically reared age-matched controls. (E) Cumulative distribution plot of mEPSC amplitude or (F) Interevent Interval recorded in wildtype and Rem2-/-mice following 2 days (Left) or 6 days (Right) of monocular deprivation. Data is presented as mean ± SEM. *p<0.05, by two-way ANOVA and Tukey post-hoc for mEPSC frequency and amplitude mean data plots.

