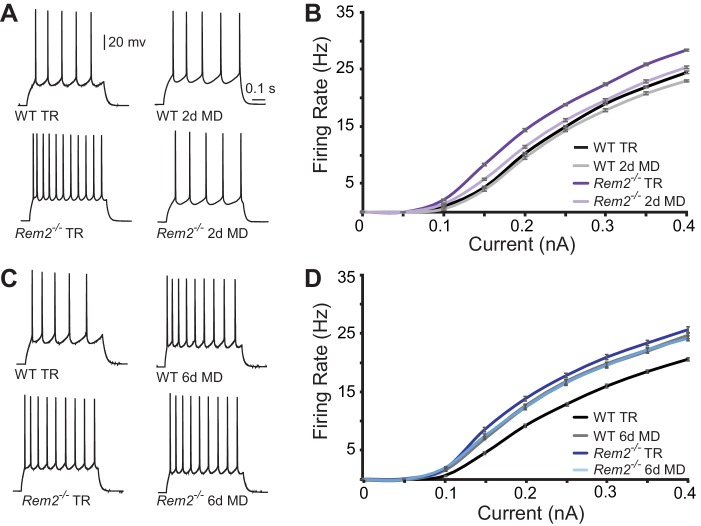
Figure 7. Rem2 alters the intrinsic excitability of layer 2/3 pyramidal neurons.
(A) Example traces of evoked action potential responses (0.2 nA current injected) of neurons from WT or Rem2-/- mice either typically reared (TR) to P28 or monocularly deprived for 2 days from P26-P28 (2d MD). (B) Average f-I curves for WT TR (black line, n = 25), WT 2d MD (gray line, n = 22), Rem2-/- TR (dark purple line, n = 23) and Rem2-/- 2d MD (light purple line, n = 22) in response to normal visual experience or 2 days of monocular deprivation. N = 4 animals per experimental condition. (C) Examples of evoked responses from neurons of WT or Rem2-/- following at P32 that were either typically reared (WT TR and Rem2-/- TR) or monocularly deprived for 6 days from P26-P32 (WT 6d MD and Rem2-/- 6d MD). (D) Average f-I curves for WT TR (black line, n = 32), WT 6d MD (gray line, n = 22), Rem2-/- TR (dark blue line, n = 24) and Rem2-/- 6d MD (light blue line, n = 22) in response to normal visual experience or after 6 days of monocular deprivation. N = 5 mice for WT TR and 4 mice for all other conditions.

