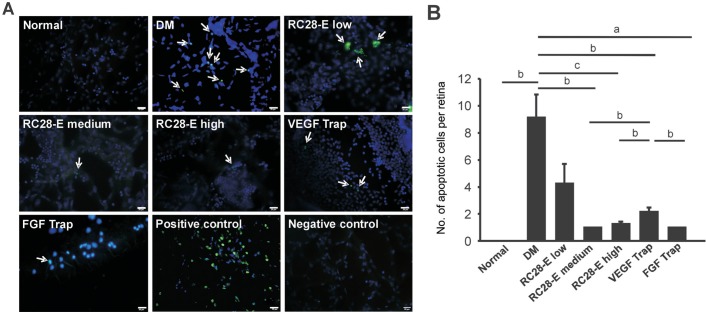
Figure 1. The apoptotic cells death in retinal vascular network of each experimental group.
A: The representative images of TUNEL staining of retinal vascular network in each group and the positive and negative controls of TUNEL staining. Arrows indicate the TUNEL-positive cells. Scale bar=20 µm. B: The apoptotic cells in each experimental group were quantified. aP<0.05, bP<0.01, cP<0.001.

