Figure 5.
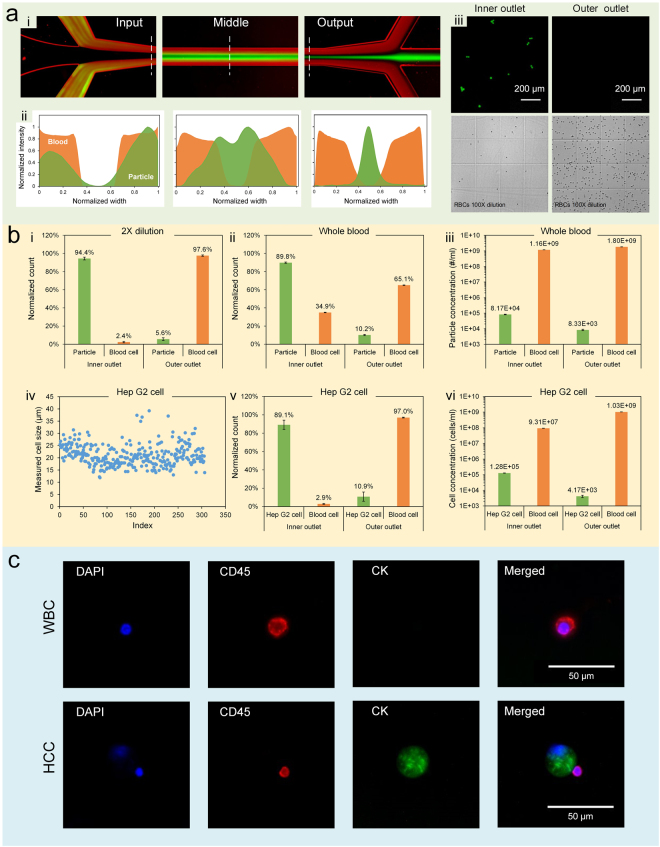
Separation performance of our co-flow system. (a) Focusing and separation of fluorescent particles (green) using a 2× dilution blood (red): (i) overlapped pseudocolored images indicating a high-efficiency separation; (ii) the corresponding intensity profiles across the dashed lines in part (i); (iii) micrographs showing the separation outcomes. (b) Quantitative results of separation performance using whole blood and 2× dilution blood spiked with particles and Hep G2 cells. Blood cells instead of RBCs were used here since WBCs were also present in the sample. However, the percentage of WBCs was less than 1%. Error bars represent standard deviation of three tests. (c) WBC and hepatocarcinoma cell (HCC) extracted and identified from clinical sample (2× dilution) in our system. Error bars are standard deviations of three tests. All flow rates were 225 µL/min with α = 1.

