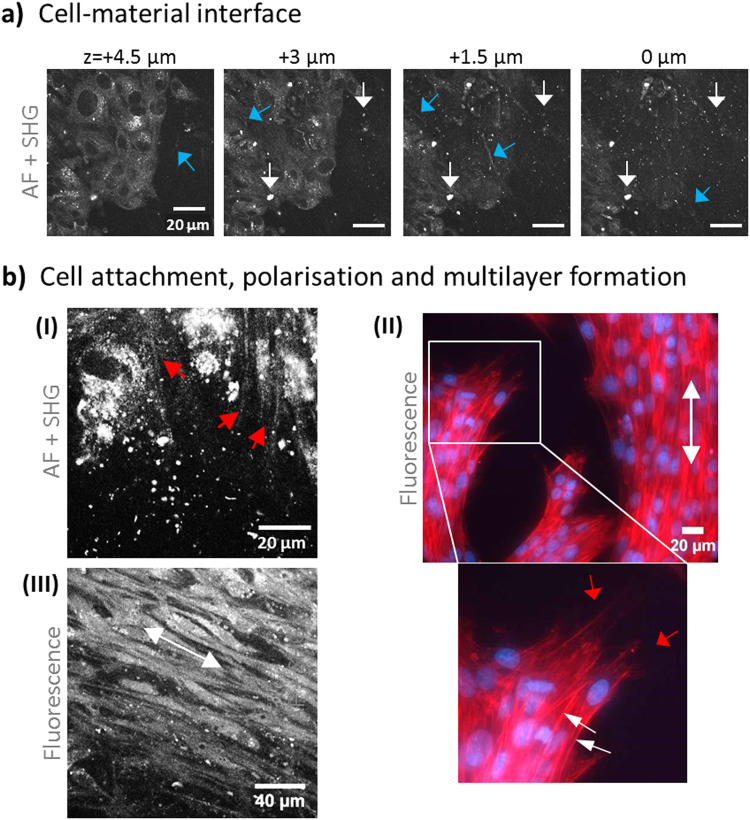
Figure 3.
Cell-material interface: attachment, anchoring and orientation on BNC. In (a), multiphoton images (unseparated, AF + SHG) highlight the MSC attachment site and a few µm above. Signals derived from BNC are visible as dots (white arrows) and fibrous structures (blue arrows). The cells become visible by their AF signal. In (b), cell anchoring structures (filopodia) are shown in both an MPM (I, red arrows) and a fluorescence image (II, phalloidin-PF546 and DAPI). The zoom image in (II) highlights anchoring structures (red arrows) and multilayer cell arrangements (white arrows directed to DAPI-stained nuclei). Cell orientation patterns (white arrow) were observed in (II) and in (III) in between cell layers (staining with Calcein AM).

