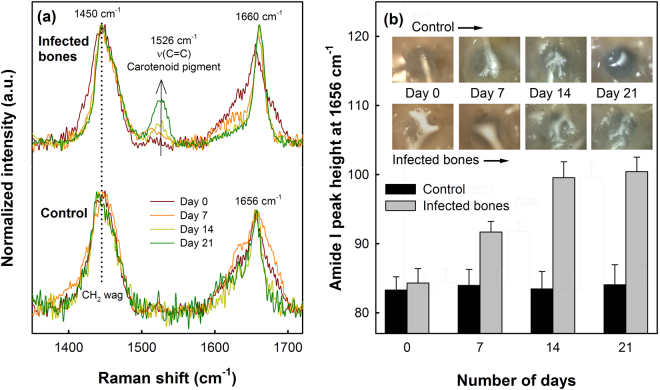
Figure 3.
(a) Variations in amide I Raman bands of the control (down) and S. aureus infected bones (above) up to 21 days. For comparison, spectra were normalized to the CH2 wag band at 1450 cm−1. (b) Variations in the Amide I band intensity at 1656 cm−1 for the control and infected bones with respect to the number of incubation days. Inset shows the optical images (size: 500 μm × 500 μm) of control and infected bone surfaces showing no considerable visual changes in the samples during the incubation periods.

