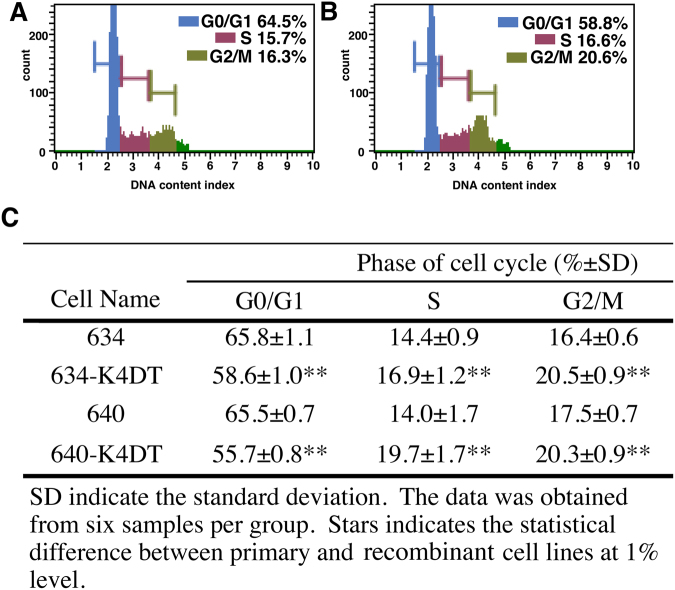
Figure 5.
Cell cycle analysis of primary and recombinant cells derived from the loggerhead sea turtle. A and B, Histograms obtained from the cell cycle analysis: (A) primary cells (A634); and (B) recombinant cells (A634 derived K4DT). The percentages of cells in the G0/G1, S and G2/M phases are shown in color. (C) Percentages of primary and recombinant loggerhead-derived cells at each cell cycle phase. The data were obtained from five replicate samples. The double asterisks indicate statistical significance at the 1% level.

