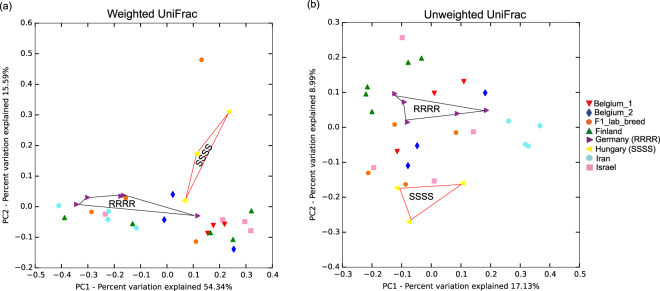
Figure 2.
Differences in microbial community structure within and between different Daphnia genotypes. Principal Coordinate Analysis based on (a) Weighted and (b) Unweighted UniFrac Distances that were rarified and jacknifed at equal sequence depth of 3893. Similar symbol represents samples belonging to the same Daphnia genotype. Microbial composition differs by Daphnia genotypes as shown by ANOSIM (Weighted UniFrac: R = 0.22, p = 0.016; Unweighted UniFrac: R = 0.50, p = 0.001) and ADONIS (Weighted UniFrac: R2 = 0.42, p = 0.007; Unweighted UniFrac: ADONIS, R2 = 0.39, p = 0.001) statistical analyses with 999 permutations. Polygons show the distinct microbiome between Daphnia genotypes with opposite resistotypes to four Pasteuria pathogen. Red polygon represents the microbiome of Hungary clone (SSSS) and black polygon represents the microbiome of Germany clone (RRRR).

