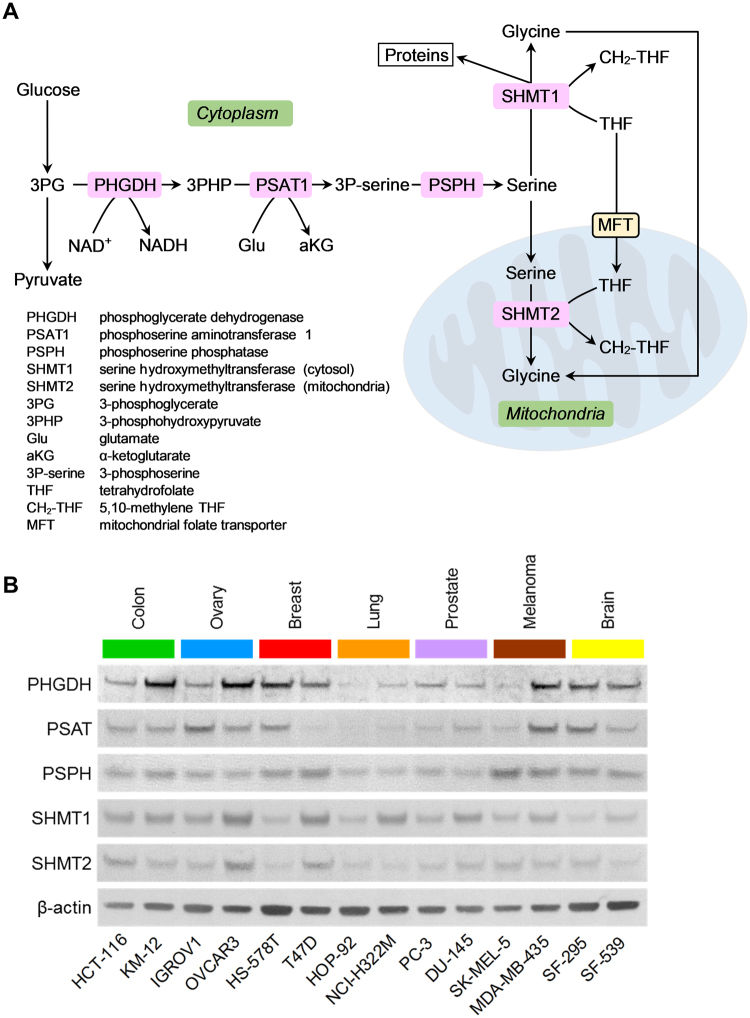
Figure 1.
Average expression levels of serine-glycine synthesis enzymes in cancer cell lines. (A) Schematic representation of pathways of serine-glycine synthesis and one-carbon metabolism. The enzymes examined in this study are highlighted with pink boxes, while cellular compartments are highlighted with green boxes. (B) Immunoblots of serine-glycine synthesis pathway enzymes in the indicated fourteen human cancer cell lines derived from seven human tissues are shown. Βeta-actin was used as loading control. The grouping of immunoblots were obtained from cropped blots obtained from different gels and are delineated by white space between them.

