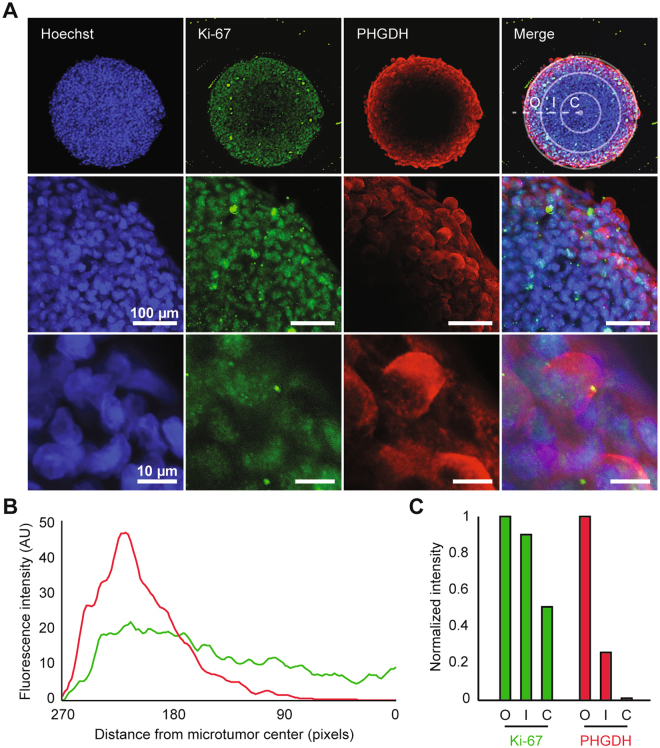
Figure 5.
PHGDH and Ki-67 expression in 3D microtumors. (A) Spatial localization of Ki-67 (green), PHGDH (red), and their overlap in mt600 microtumors at low- (top panel), intermediate (middle panel) and high magnification (bottom panel). Confocal images are centered on the middle plane of the microtumor. In the overlay panels Hoechst counterstain (blue color) indicates cell nuclei. PHGDH expression is restricted to the outer layer of Ki-67+ cells. Concentric circles in the top right panel depict the outer layer (O), inner layer (I), and core (C) regions of the microtumor. (B) Average of nine radial linescans for Ki-67 (green) and PHGDH (red) fluorescence intensity. (C) Average of Ki-67 and PHGDH fluorescence intensity in each of the microtumor compartments.

