
Figure 2.
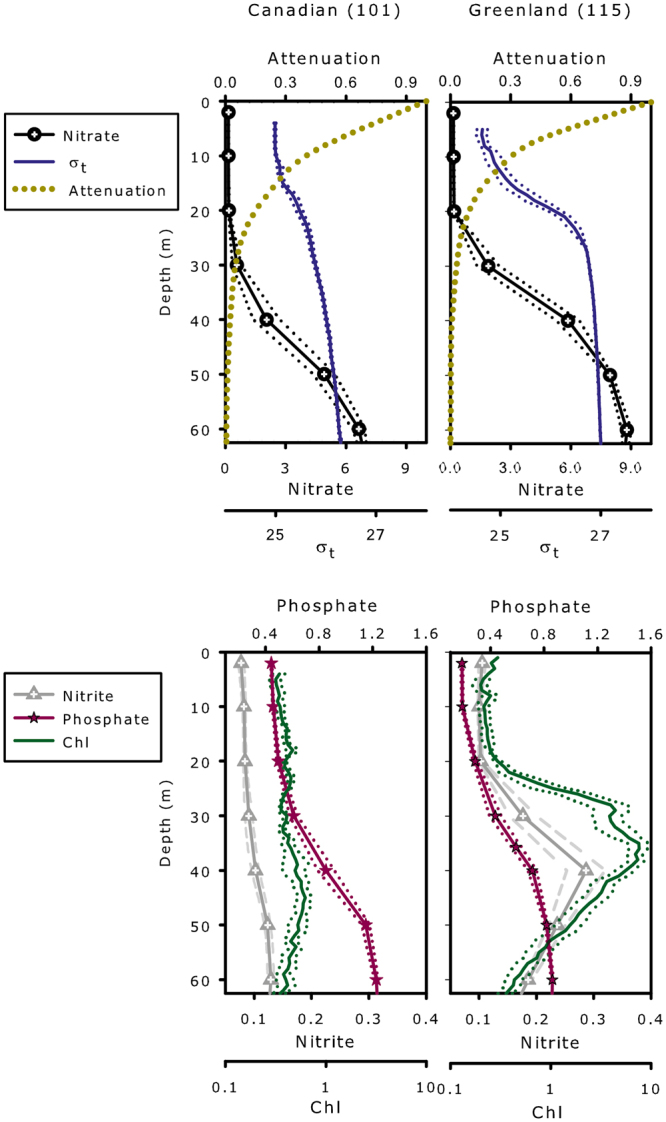
Vertical profiles of the upper 60 m of the water column on the Canadian side (Stn 101) and Greenland side (Stn 115) of the North Water. Upper panels) attenuation of photosynthetically available radiation (PAR), nitrate concentration (in µM), and water density (σt in kg m−3). Lower panels) phosphate and nitrite concentrations (in µM), and chlorophyll fluorescence (Chl in arbitrary units). The single dotted line for PAR attenuation was from T2 for Stn 101 and from T3 for Stn 115. Central solid lines are the average of 7 profiles (time T1 to T7), with exterior dotted lines showing the standard error.