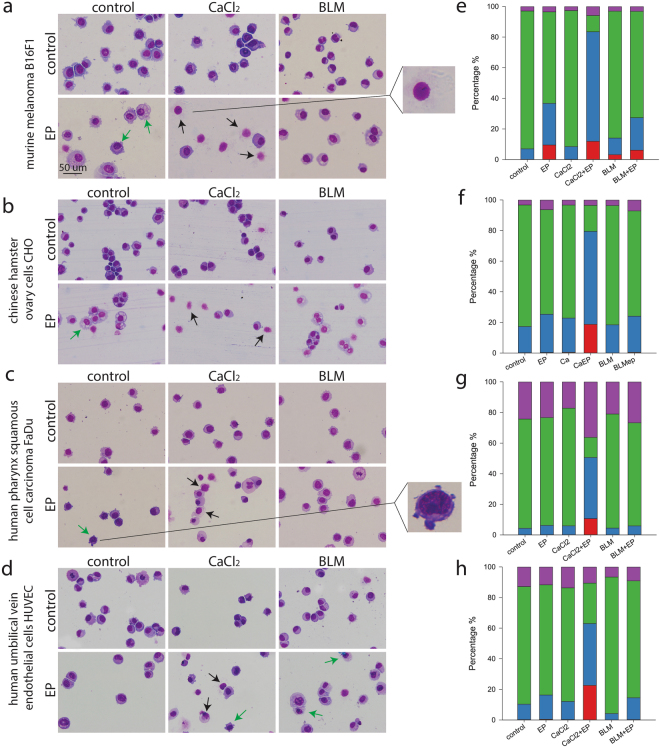
Figure 2.
Cell morphology and type of cell death after CaEP or ECT with bleomycin (BLM). (a–d) Black arrows represent necrotic cells with ruptured membranes and cell lysis (example magnified on upper right). Green arrows indicate cells with early signs of apoptosis, such as vacuolisation of cytosol (example magnified on lower right). Morphological changes were assessed in at least two independent experiments with two parallels. (e–h) Percentage of viable cells (negative; green), apoptotic cells (Annexin V positive; purple), late apoptotic/necrotic cells (Annexin V + 7-AAD positive; blue) and necrotic cells (7-AAD positive; red) after different treatments is shown. Each graph corresponds to the cell line in the same row. Bars represent the average of the experiment with two parallels repeated twice.

