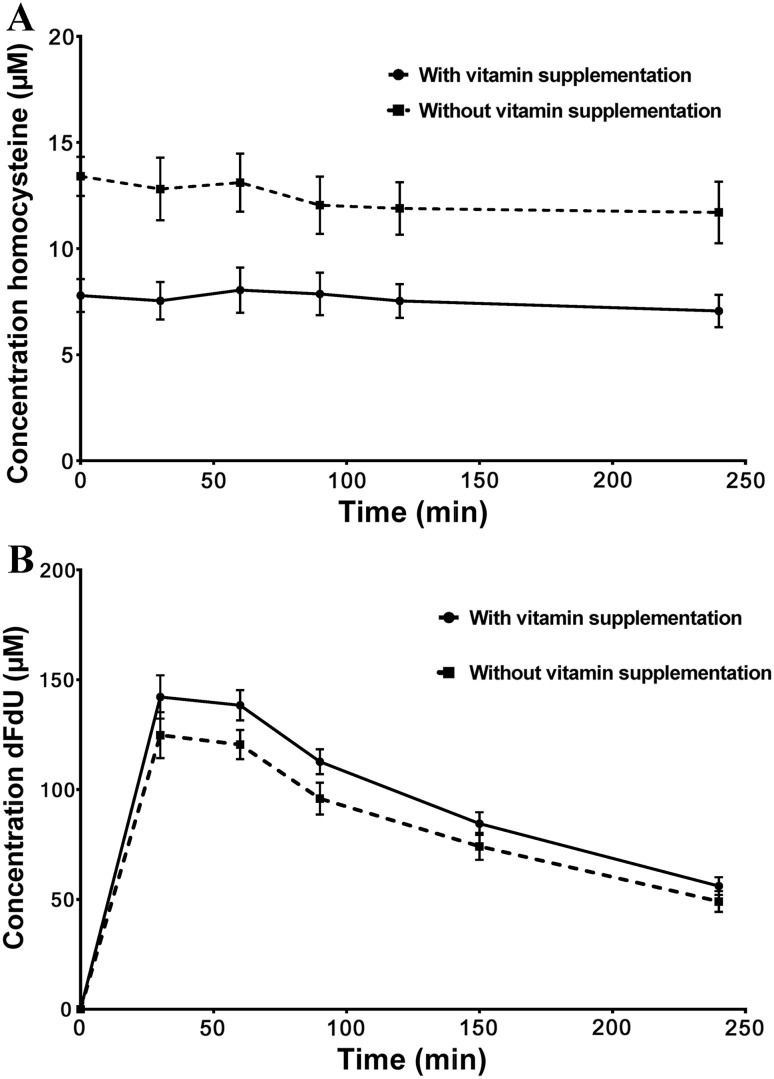
Fig. 3.
Plasma concentrations of homocysteine and dFdU in vitamin supplemented and unsupplemented the patients from the pharmacokinetics cohort. a The black line represents the supplemented arm, while the dotted line represents the unsupplemented arm. Values are means ± SEM from ten patients in each cohort. Homocysteine levels were lower in supplemented patients vs. unsupplemented patients (mean 6.9 ± 1.6 µM; range 6.2–7.2 vs. 12.5 ± 4.0 µM; range 11.7–13.4; p < 0.001); b The black line represents the supplemented arm, while the dotted line represents the unsupplemented arm. Supplementation resulted in increased levels of the gemcitabine metabolite dFdU (p < 0.05). Values are means ± SEM from 10 to 7 patients, respectively

