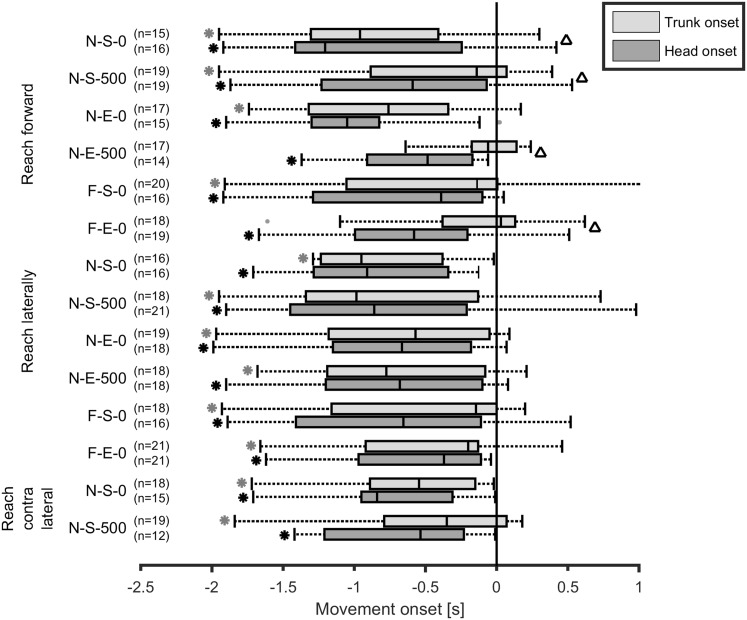
Fig. 10.
Trunk and head movement onset relative to the arm movement onset for all reaching tasks. Boxes represent 25th, 50th and 75th percentile, whiskers minimum and maximum of non-outlier values, and the dots indicate two outliers above 1.5 times the interquartile range. *A significant difference (p < 0.05) for the trunk or head with respect to zero (e.g., arm movement onset) and the ∆ a significant difference (p < 0.05) between trunk and head onset

