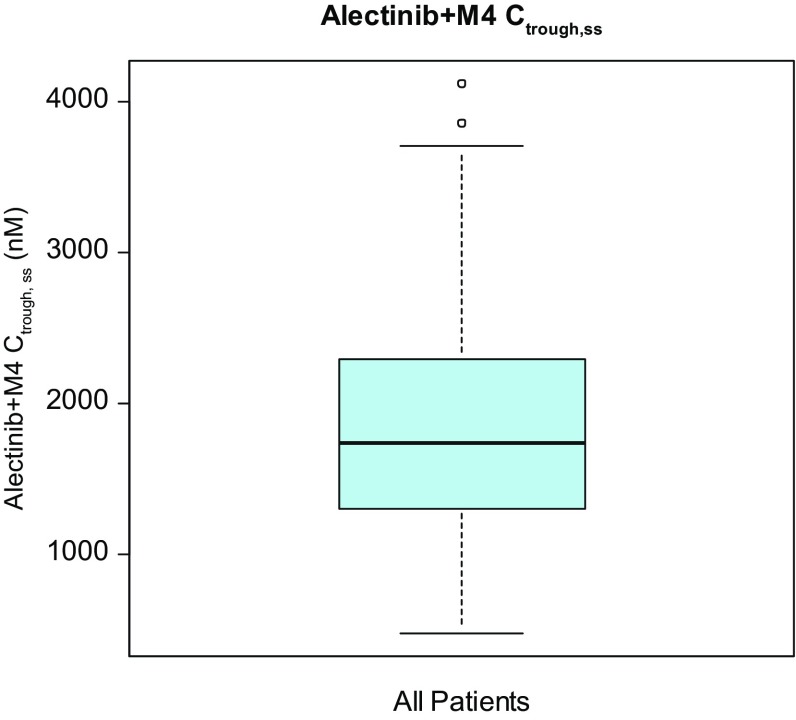
Fig. 1.
Distribution of alectinib + M4 Ctrough,ss across all patients in exposure–response population. The black line in the center of the box represents the median value of the continuous Ctrough,ss. Boxes indicate the inter-quartile range (IQR). Whiskers represent 1.5*IQR. Outliers are marked outside of the whiskers by circles

